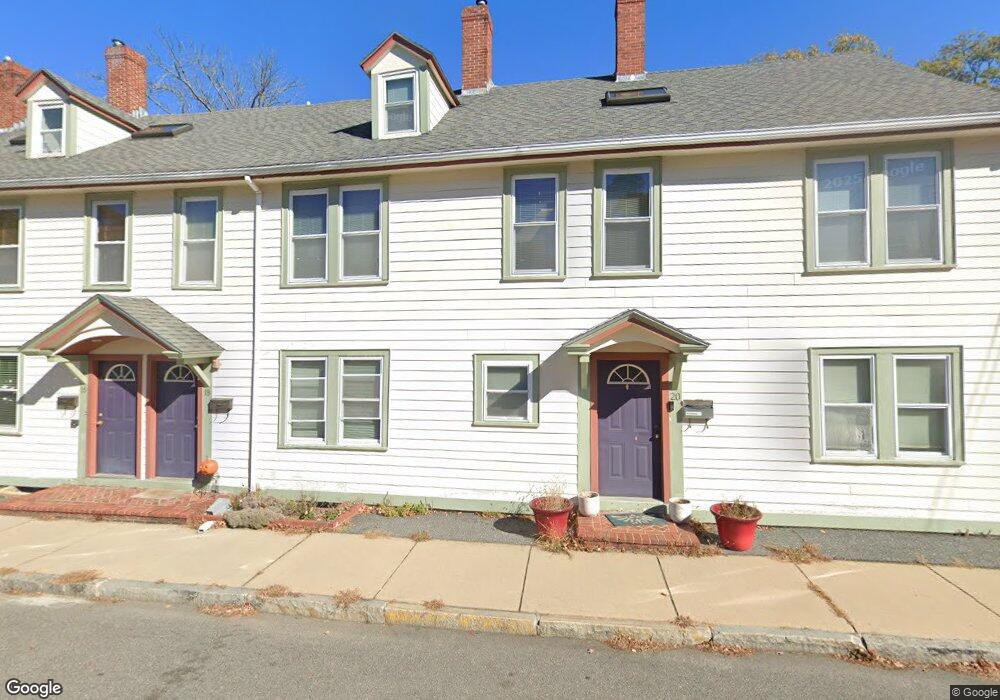
20 Aubin St Amesbury, MA 01913
Estimated Value: $356,000 - $464,000
3
Beds
1
Bath
1,252
Sq Ft
$327/Sq Ft
Est. Value
About This Home
This home is located at 20 Aubin St, Amesbury, MA 01913 and is currently estimated at $409,008, approximately $326 per square foot. 20 Aubin St is a home located in Essex County with nearby schools including Amesbury High School and Amesbury Seventh-Day Adventist School.
Ownership History
Date
Name
Owned For
Owner Type
Purchase Details
Closed on
Mar 30, 2010
Sold by
Fed Sb
Bought by
Goldthwaite James G
Current Estimated Value
Home Financials for this Owner
Home Financials are based on the most recent Mortgage that was taken out on this home.
Original Mortgage
$148,000
Outstanding Balance
$97,902
Interest Rate
5.02%
Mortgage Type
Purchase Money Mortgage
Estimated Equity
$311,106
Purchase Details
Closed on
Nov 17, 2009
Sold by
Brady David William and Brady Annette Marie
Bought by
Fed Sb
Purchase Details
Closed on
May 27, 2003
Sold by
Oth Nt and Shane Michael S
Bought by
Brady David William and Brady Annette M
Home Financials for this Owner
Home Financials are based on the most recent Mortgage that was taken out on this home.
Original Mortgage
$167,787
Interest Rate
5.86%
Mortgage Type
Purchase Money Mortgage
Create a Home Valuation Report for This Property
The Home Valuation Report is an in-depth analysis detailing your home's value as well as a comparison with similar homes in the area
Home Values in the Area
Average Home Value in this Area
Purchase History
| Date | Buyer | Sale Price | Title Company |
|---|---|---|---|
| Goldthwaite James G | $156,000 | -- | |
| Fed Sb | $194,200 | -- | |
| Brady David William | $162,900 | -- |
Source: Public Records
Mortgage History
| Date | Status | Borrower | Loan Amount |
|---|---|---|---|
| Open | Brady David William | $148,000 | |
| Previous Owner | Brady David William | $194,200 | |
| Previous Owner | Brady David William | $14,554 | |
| Previous Owner | Brady David William | $167,787 |
Source: Public Records
Tax History Compared to Growth
Tax History
| Year | Tax Paid | Tax Assessment Tax Assessment Total Assessment is a certain percentage of the fair market value that is determined by local assessors to be the total taxable value of land and additions on the property. | Land | Improvement |
|---|---|---|---|---|
| 2025 | $4,120 | $269,300 | $0 | $269,300 |
| 2024 | $4,013 | $256,600 | $0 | $256,600 |
| 2023 | $3,757 | $229,900 | $0 | $229,900 |
| 2022 | $3,320 | $187,700 | $0 | $187,700 |
| 2021 | $3,298 | $180,700 | $0 | $180,700 |
| 2020 | $3,031 | $176,400 | $0 | $176,400 |
| 2019 | $3,035 | $165,200 | $0 | $165,200 |
| 2018 | $3,004 | $158,200 | $0 | $158,200 |
| 2017 | $3,174 | $159,100 | $0 | $159,100 |
| 2016 | $3,166 | $156,100 | $0 | $156,100 |
| 2015 | $3,206 | $156,100 | $0 | $156,100 |
| 2014 | $3,051 | $145,500 | $0 | $145,500 |
Source: Public Records
Map
Nearby Homes
- 43 Aubin St Unit 43
- 37 Millyard Unit 204
- 13 High St Unit 2
- 4 Clark St
- 93 Friend St
- 4 Winter St
- 5 Richs Ct Unit 3
- 18 E Greenwood St
- 97 Elm St
- 118 Elm St
- 4 Greenwood St
- 25 Cedar St Unit 4
- 25 Cedar St Unit 14
- 25 Cedar St Unit 7
- 25 Cedar St Unit 3
- 161 Elm St Unit A
- 3 Arlington St
- 101 Market St Unit B
- 101 Market St Unit A
- 105 Market St Unit B
- 18 Aubin St
- 16 Aubin St
- 18 Aubin St Unit 14-20
- 18 Aubin St Unit 18
- 14 Aubin St
- 14 Aubin St Unit 14
- 22 Aubin St Unit P
- 22 Aubin St Unit 3
- 22 Aubin St Unit 1
- 22 Aubin St Unit 2
- 24 Aubin St
- 11 Aubin St Unit 2
- 11 Aubin St Unit 1F
- 11 Aubin St
- 10 Aubin St
- 21 Aubin St
- 25 Aubin St
- 15 Aubin St
- 13 Aubin St Unit 1
- 13 Aubin St