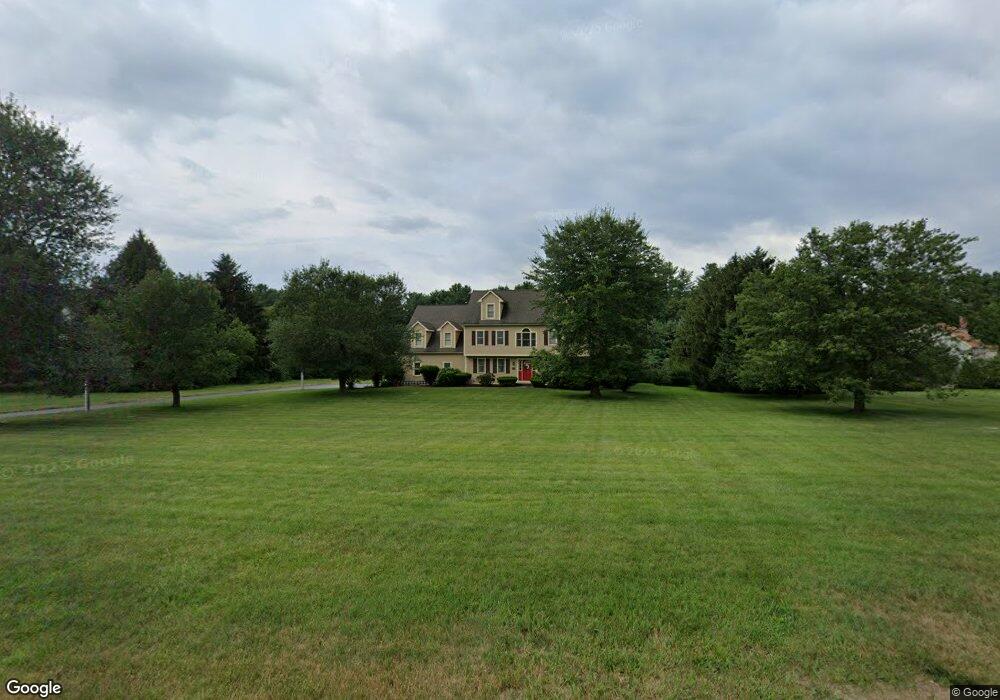
20 Autumn Rd Wrentham, MA 02093
West Wrentham NeighborhoodEstimated Value: $1,093,485 - $1,254,000
4
Beds
4
Baths
3,808
Sq Ft
$304/Sq Ft
Est. Value
About This Home
This home is located at 20 Autumn Rd, Wrentham, MA 02093 and is currently estimated at $1,156,121, approximately $303 per square foot. 20 Autumn Rd is a home located in Norfolk County with nearby schools including Delaney Elementary School, Charles E Roderick, and Benjamin Franklin Classical Charter Public School.
Ownership History
Date
Name
Owned For
Owner Type
Purchase Details
Closed on
Mar 28, 1997
Sold by
Czeth Michael P
Bought by
Girouard David R and Girouard Joyce K
Current Estimated Value
Purchase Details
Closed on
Feb 28, 1992
Sold by
Bailey & Zahner Bldrs
Bought by
Czech Michael P
Create a Home Valuation Report for This Property
The Home Valuation Report is an in-depth analysis detailing your home's value as well as a comparison with similar homes in the area
Home Values in the Area
Average Home Value in this Area
Purchase History
| Date | Buyer | Sale Price | Title Company |
|---|---|---|---|
| Girouard David R | $297,500 | -- | |
| Girouard David R | $297,500 | -- | |
| Czech Michael P | $250,000 | -- | |
| Czech Michael P | $250,000 | -- |
Source: Public Records
Mortgage History
| Date | Status | Borrower | Loan Amount |
|---|---|---|---|
| Open | Czech Michael P | $415,000 | |
| Closed | Czech Michael P | $360,000 |
Source: Public Records
Tax History Compared to Growth
Tax History
| Year | Tax Paid | Tax Assessment Tax Assessment Total Assessment is a certain percentage of the fair market value that is determined by local assessors to be the total taxable value of land and additions on the property. | Land | Improvement |
|---|---|---|---|---|
| 2025 | $10,904 | $940,800 | $288,000 | $652,800 |
| 2024 | $10,444 | $870,300 | $288,000 | $582,300 |
| 2023 | $10,668 | $845,300 | $261,900 | $583,400 |
| 2022 | $10,237 | $748,900 | $255,100 | $493,800 |
| 2021 | $9,763 | $693,900 | $238,400 | $455,500 |
| 2020 | $10,159 | $712,900 | $182,000 | $530,900 |
| 2019 | $9,733 | $689,300 | $182,000 | $507,300 |
| 2018 | $8,894 | $624,600 | $181,800 | $442,800 |
| 2017 | $8,644 | $606,600 | $178,300 | $428,300 |
| 2016 | $8,449 | $591,700 | $173,200 | $418,500 |
| 2015 | $8,398 | $560,600 | $166,500 | $394,100 |
| 2014 | $8,529 | $557,100 | $160,100 | $397,000 |
Source: Public Records
Map
Nearby Homes
- 50 Wamsutta Way
- 236 Williams St
- 2095 West St
- 60 Grant Ave
- 50 Heather Ln
- 39 Sumner Brown Rd
- 25 Nature View Dr
- 20 Nature View Dr
- 180 Pine Swamp Rd
- 56 Pine Swamp Rd
- 17 Stanford Rd
- 851 Washington St
- 10 Stanford Rd
- 9 Pebble Cir Unit 9
- 2 Duhamel Way
- 584 Washington St
- 65 Palmetto Dr Unit 65
- 21 Palmetto Dr Unit 21
- 24 Palmetto Dr Unit 24
- 219 Dawn Blvd