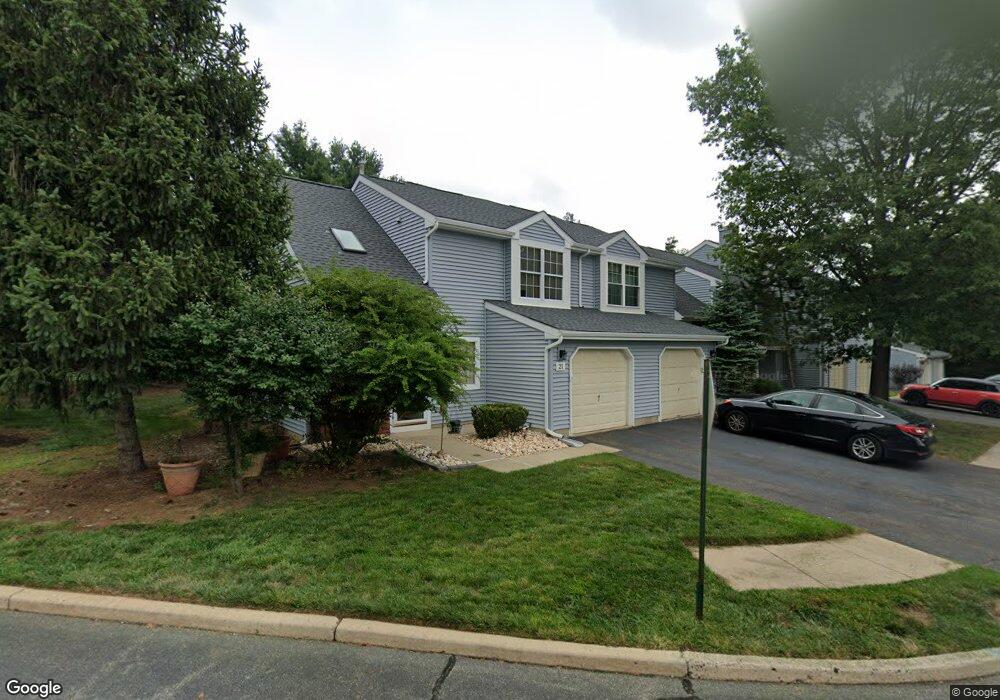
20 Avebury Place Unit na Somerset, NJ 08873
Estimated Value: $474,000 - $494,973
2
Beds
3
Baths
1,420
Sq Ft
$342/Sq Ft
Est. Value
About This Home
This home is located at 20 Avebury Place Unit na, Somerset, NJ 08873 and is currently estimated at $485,493, approximately $341 per square foot. 20 Avebury Place Unit na is a home located in Somerset County with nearby schools including Franklin High School, Thomas Edison EnergySmart Charter School, and Guidepost Montessori at Somerset.
Ownership History
Date
Name
Owned For
Owner Type
Purchase Details
Closed on
Jun 17, 2024
Sold by
Hsiao Yolanda and Ashraf Atif
Bought by
Dalwadi Raj and Dalwadi Kinnari Raj
Current Estimated Value
Home Financials for this Owner
Home Financials are based on the most recent Mortgage that was taken out on this home.
Original Mortgage
$429,999
Outstanding Balance
$424,585
Interest Rate
7.09%
Mortgage Type
New Conventional
Estimated Equity
$60,908
Purchase Details
Closed on
Mar 7, 2015
Sold by
Carullo Joseph
Bought by
Hsaio Yolanda
Purchase Details
Closed on
Jan 29, 2014
Sold by
Gandolfo Roxanne
Bought by
Carullo Joseph and Ullio Donna
Purchase Details
Closed on
Sep 11, 2012
Sold by
Crullo Joseph
Bought by
Carullo Joseph and Ullio Donna
Create a Home Valuation Report for This Property
The Home Valuation Report is an in-depth analysis detailing your home's value as well as a comparison with similar homes in the area
Home Values in the Area
Average Home Value in this Area
Purchase History
| Date | Buyer | Sale Price | Title Company |
|---|---|---|---|
| Dalwadi Raj | $477,777 | First American Title | |
| Dalwadi Raj | $477,777 | First American Title | |
| Hsaio Yolanda | $217,500 | Agent For Westcor Land Title | |
| Carullo Joseph | -- | None Available | |
| Carullo Joseph | -- | None Available |
Source: Public Records
Mortgage History
| Date | Status | Borrower | Loan Amount |
|---|---|---|---|
| Open | Dalwadi Raj | $429,999 | |
| Closed | Dalwadi Raj | $429,999 |
Source: Public Records
Tax History Compared to Growth
Tax History
| Year | Tax Paid | Tax Assessment Tax Assessment Total Assessment is a certain percentage of the fair market value that is determined by local assessors to be the total taxable value of land and additions on the property. | Land | Improvement |
|---|---|---|---|---|
| 2025 | $6,876 | $437,100 | $200,000 | $237,100 |
| 2024 | $6,876 | $378,200 | $200,000 | $178,200 |
| 2023 | $6,531 | $338,200 | $160,000 | $178,200 |
| 2022 | $5,975 | $293,200 | $115,000 | $178,200 |
| 2021 | $5,941 | $268,200 | $90,000 | $178,200 |
| 2020 | $5,732 | $253,200 | $75,000 | $178,200 |
| 2019 | $5,829 | $253,200 | $75,000 | $178,200 |
| 2018 | $5,564 | $239,200 | $65,000 | $174,200 |
| 2017 | $5,350 | $229,200 | $55,000 | $174,200 |
| 2016 | $5,271 | $224,200 | $50,000 | $174,200 |
| 2015 | $5,235 | $224,200 | $50,000 | $174,200 |
| 2014 | $5,276 | $229,200 | $55,000 | $174,200 |
Source: Public Records
Map
Nearby Homes
- 76 Avebury Place
- 77 Avebury Place
- 139 Skipton Place
- 58 Boxgrove Place
- 450 Saint Giles Ct
- 266 Dochery Place
- 130 Selby Ct
- 169 Becket Place
- 112 Aimwick Ct
- 342 Smithwold Rd
- 5 Alton Dr
- 110 Wycombe Place
- 77 Haverhill Place
- 9 Henley Dr
- 11 Henley Dr
- 55 Cherrywood Dr
- 90 Almond Dr
- 168 Picadilly Place
- 1303 Fir Ct
- 591 Post Ln
- 20 Avebury Place
- 19 Avebury Place
- 21 Avebury Place
- 18 Avebury Place
- 17 Avebury Place
- 16 Avebury Place
- 23 Avebury Place
- 24 Avebury Place
- 22 Avebury Place
- 25 Avebury Place
- 26 Avebury Place
- 27 Avebury Place
- 28 Avebury Place
- 30 Avebury Place
- 31 Avebury Place
- 29 Avebury Place
- 12 Lyndhurst Dr
- 39 Whitby Cir
- 40 Whitby Cir
- 38 Whitby Cir