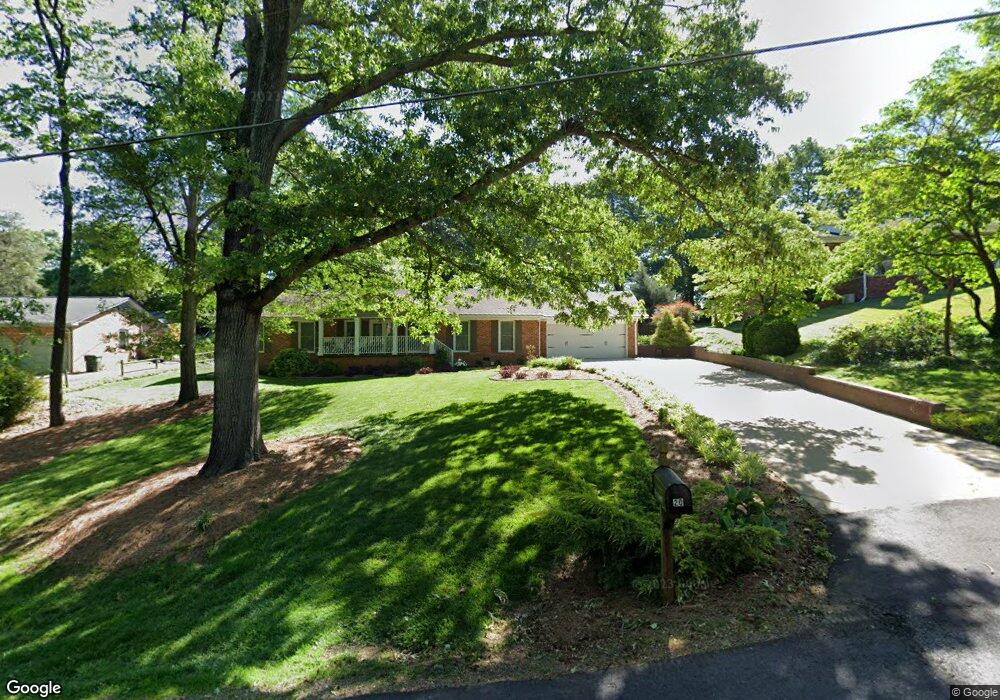
20 Badger Dr Taylors, SC 29687
Estimated Value: $302,000 - $382,000
3
Beds
2
Baths
1,885
Sq Ft
$176/Sq Ft
Est. Value
About This Home
This home is located at 20 Badger Dr, Taylors, SC 29687 and is currently estimated at $332,682, approximately $176 per square foot. 20 Badger Dr is a home located in Greenville County with nearby schools including Taylors Elementary School, Greer Middle School, and Greer High School.
Ownership History
Date
Name
Owned For
Owner Type
Purchase Details
Closed on
Sep 5, 2014
Sold by
Coker Robert Lee and Coker Kacie Barnette
Bought by
Matson Suzanne C
Current Estimated Value
Home Financials for this Owner
Home Financials are based on the most recent Mortgage that was taken out on this home.
Original Mortgage
$80,000
Outstanding Balance
$25,370
Interest Rate
3.33%
Mortgage Type
Future Advance Clause Open End Mortgage
Estimated Equity
$307,312
Purchase Details
Closed on
Jun 20, 2011
Sold by
Coker Kacie Barnette
Bought by
Coker Kacie Barnette and Coker Robert Lee
Home Financials for this Owner
Home Financials are based on the most recent Mortgage that was taken out on this home.
Original Mortgage
$175,437
Interest Rate
4.75%
Mortgage Type
FHA
Purchase Details
Closed on
Sep 1, 2010
Sold by
Jackson Katherine C and Jackson Gerald S
Bought by
The Bank Of New York Mellon Trust Compan
Purchase Details
Closed on
Aug 27, 2010
Sold by
The Bank Of New York Mellon Trust Compan
Bought by
Bishop Fred M
Create a Home Valuation Report for This Property
The Home Valuation Report is an in-depth analysis detailing your home's value as well as a comparison with similar homes in the area
Home Values in the Area
Average Home Value in this Area
Purchase History
| Date | Buyer | Sale Price | Title Company |
|---|---|---|---|
| Matson Suzanne C | $189,900 | -- | |
| Coker Kacie Barnette | -- | -- | |
| Coker Kacie Barnette | $180,000 | -- | |
| The Bank Of New York Mellon Trust Compan | $118,676 | -- | |
| Bishop Fred M | $72,000 | -- |
Source: Public Records
Mortgage History
| Date | Status | Borrower | Loan Amount |
|---|---|---|---|
| Open | Matson Suzanne C | $80,000 | |
| Previous Owner | Coker Kacie Barnette | $175,437 |
Source: Public Records
Tax History Compared to Growth
Tax History
| Year | Tax Paid | Tax Assessment Tax Assessment Total Assessment is a certain percentage of the fair market value that is determined by local assessors to be the total taxable value of land and additions on the property. | Land | Improvement |
|---|---|---|---|---|
| 2024 | $1,141 | $7,460 | $1,080 | $6,380 |
| 2023 | $1,141 | $7,460 | $1,080 | $6,380 |
| 2022 | $1,058 | $7,460 | $1,080 | $6,380 |
| 2021 | $1,153 | $7,460 | $1,080 | $6,380 |
| 2020 | $1,192 | $7,320 | $1,080 | $6,240 |
| 2019 | $1,179 | $7,320 | $1,080 | $6,240 |
| 2018 | $1,159 | $7,320 | $1,080 | $6,240 |
| 2017 | $1,145 | $7,320 | $1,080 | $6,240 |
| 2016 | $1,093 | $182,970 | $27,000 | $155,970 |
| 2015 | $1,462 | $182,970 | $27,000 | $155,970 |
| 2014 | $1,377 | $176,620 | $27,000 | $149,620 |
Source: Public Records
Map
Nearby Homes
- 311 Wood Rd
- 114 Casa Loma Dr
- 705 Hayden Ct
- 406 Crescentwood Ct
- 85 Robinson Rd
- 421 Wood Rd
- 2 Robinson Rd
- 813 E Main St
- 99 River Park Ln
- 202 Highland St
- 200 Highland St
- 33 Michell Dr
- 219 Catskill Dr
- 240 Catskill Dr
- 7 Willow Wood Ct
- 106 Sturgeon Bay Dr
- 4 Dolerite Dr
- 8 Gentian Ct
- 102 Stone Brook Ct
- 104 Stone Brook Ct
- 100 Badger Dr
- 16 Badger Dr
- 309 Tumbleweed Terrace
- 313 Tumbleweed Terrace
- 14 Badger Dr
- 307 Tumbleweed Terrace
- 102 Badger Dr
- 315 Tumbleweed Terrace
- 21 Badger Dr
- 305 Tumbleweed Terrace
- 17 Badger Dr
- 10 Badger Dr
- 317 Tumbleweed Terrace
- 303 Tumbleweed Terrace
- 101 Badger Dr
- 11 Badger Dr
- 8 Badger Dr
- 110 Badger Dr
- 306 Tumbleweed Terrace
- 308 Tumbleweed Terrace