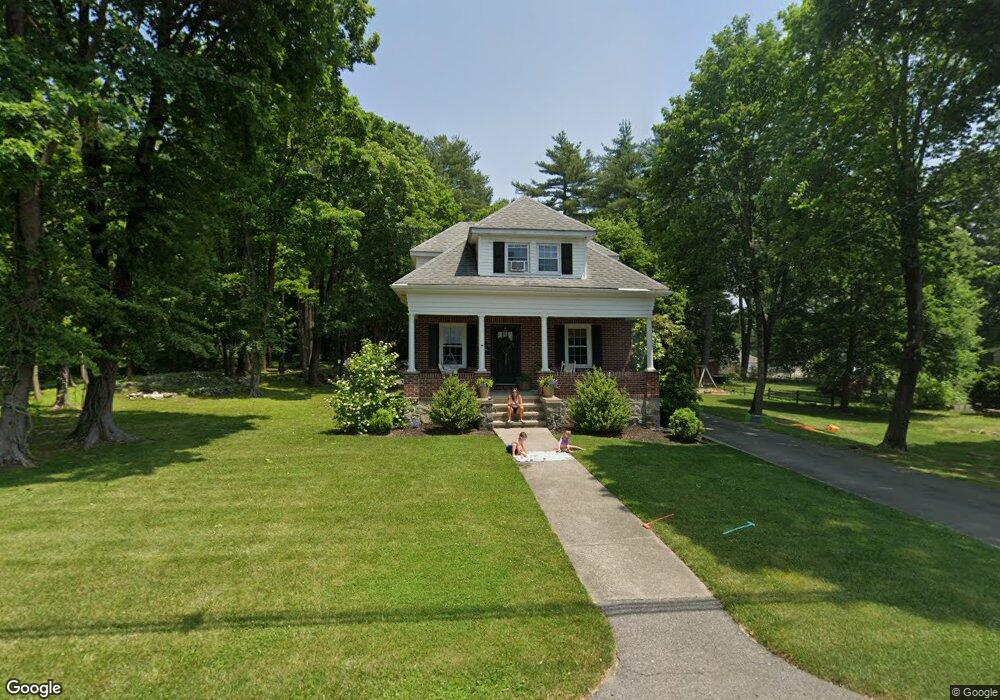
20 Baldwin St North Easton, MA 02356
Estimated Value: $589,000 - $713,000
3
Beds
1
Bath
1,455
Sq Ft
$437/Sq Ft
Est. Value
About This Home
This home is located at 20 Baldwin St, North Easton, MA 02356 and is currently estimated at $635,898, approximately $437 per square foot. 20 Baldwin St is a home located in Bristol County with nearby schools including Easton Middle School.
Ownership History
Date
Name
Owned For
Owner Type
Purchase Details
Closed on
Sep 1, 2017
Sold by
Decouto Thomas
Bought by
Lapierre Jessica M and Fontes Thomas
Current Estimated Value
Home Financials for this Owner
Home Financials are based on the most recent Mortgage that was taken out on this home.
Original Mortgage
$266,400
Outstanding Balance
$221,758
Interest Rate
3.96%
Mortgage Type
New Conventional
Estimated Equity
$414,140
Purchase Details
Closed on
Jul 28, 2017
Sold by
Farransn Ft and Kaupp
Bought by
Decouto Thomas
Home Financials for this Owner
Home Financials are based on the most recent Mortgage that was taken out on this home.
Original Mortgage
$266,400
Outstanding Balance
$221,758
Interest Rate
3.96%
Mortgage Type
New Conventional
Estimated Equity
$414,140
Purchase Details
Closed on
May 6, 2014
Sold by
Farrand Robert A and Farrand Marguerite L
Bought by
Farrand Ft and Kaupp
Purchase Details
Closed on
Apr 20, 1977
Bought by
Kaupp Susan L
Create a Home Valuation Report for This Property
The Home Valuation Report is an in-depth analysis detailing your home's value as well as a comparison with similar homes in the area
Home Values in the Area
Average Home Value in this Area
Purchase History
| Date | Buyer | Sale Price | Title Company |
|---|---|---|---|
| Lapierre Jessica M | $333,000 | -- | |
| Lapierre Jessica M | $333,000 | -- | |
| Decouto Thomas | $333,000 | -- | |
| Decouto Thomas | $333,000 | -- | |
| Farrand Ft | -- | -- | |
| Farrand Ft | -- | -- | |
| Farrand Ft | -- | -- | |
| Kaupp Susan L | -- | -- |
Source: Public Records
Mortgage History
| Date | Status | Borrower | Loan Amount |
|---|---|---|---|
| Open | Lapierre Jessica M | $266,400 | |
| Closed | Lapierre Jessica M | $266,400 | |
| Previous Owner | Kaupp Susan L | $55,000 |
Source: Public Records
Tax History Compared to Growth
Tax History
| Year | Tax Paid | Tax Assessment Tax Assessment Total Assessment is a certain percentage of the fair market value that is determined by local assessors to be the total taxable value of land and additions on the property. | Land | Improvement |
|---|---|---|---|---|
| 2025 | $6,707 | $537,400 | $353,600 | $183,800 |
| 2024 | $6,070 | $454,700 | $270,900 | $183,800 |
| 2023 | $5,851 | $401,000 | $270,900 | $130,100 |
| 2022 | $5,708 | $370,900 | $243,200 | $127,700 |
| 2021 | $5,545 | $358,200 | $230,500 | $127,700 |
| 2020 | $5,366 | $348,900 | $221,200 | $127,700 |
| 2019 | $4,943 | $309,700 | $190,000 | $119,700 |
| 2018 | $4,119 | $254,100 | $179,700 | $74,400 |
| 2017 | $4,122 | $254,100 | $179,700 | $74,400 |
| 2016 | $3,957 | $244,400 | $162,900 | $81,500 |
| 2015 | $4,166 | $248,300 | $166,800 | $81,500 |
| 2014 | $3,841 | $230,700 | $149,200 | $81,500 |
Source: Public Records
Map
Nearby Homes
- 56 Williams St
- 67 Center St
- 32 Spooner St
- 224 Main St
- 11 Olde Stable Ln
- 334-336 Main St
- 8 Hobart Way
- 7 Coolidge Cir
- 24 Eisenhower Dr
- 18 Prudence Crandall Ln Unit 18
- 280 Washington St
- 15 King Ave
- 1 Whittier Ln Unit 1
- 45 Randall St
- 73 Summer St
- 79 Summer St
- 21 Scotch Dam Rd
- 12 Holmes St
- 9 Oak Ridge Dr
- Lot 8 Cooper Ln