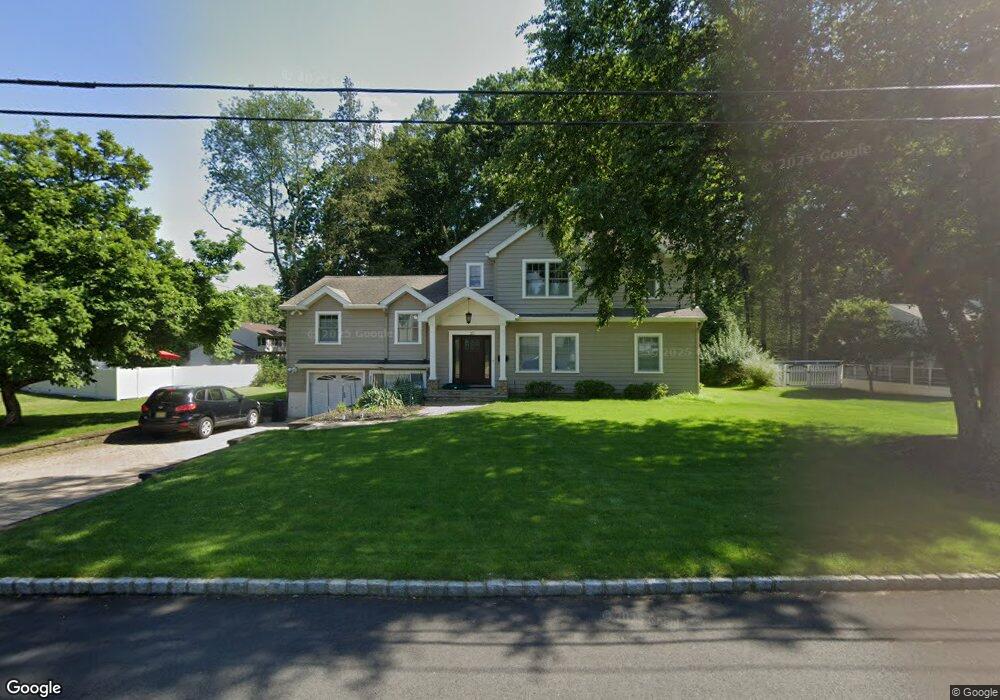
20 Beechwood Place Harrington Park, NJ 07640
Estimated Value: $1,075,794 - $1,189,000
--
Bed
--
Bath
3,609
Sq Ft
$311/Sq Ft
Est. Value
About This Home
This home is located at 20 Beechwood Place, Harrington Park, NJ 07640 and is currently estimated at $1,121,949, approximately $310 per square foot. 20 Beechwood Place is a home located in Bergen County with nearby schools including Harrington Park Elementary School and Northern Valley Regional High School at Old Tappan.
Ownership History
Date
Name
Owned For
Owner Type
Purchase Details
Closed on
Apr 22, 2003
Sold by
Langfelder Andrew J
Bought by
Orfan James and Orfan Anastasia
Current Estimated Value
Home Financials for this Owner
Home Financials are based on the most recent Mortgage that was taken out on this home.
Original Mortgage
$378,250
Outstanding Balance
$163,329
Interest Rate
5.82%
Estimated Equity
$958,620
Create a Home Valuation Report for This Property
The Home Valuation Report is an in-depth analysis detailing your home's value as well as a comparison with similar homes in the area
Home Values in the Area
Average Home Value in this Area
Purchase History
| Date | Buyer | Sale Price | Title Company |
|---|---|---|---|
| Orfan James | $445,000 | -- |
Source: Public Records
Mortgage History
| Date | Status | Borrower | Loan Amount |
|---|---|---|---|
| Open | Orfan James | $378,250 |
Source: Public Records
Tax History Compared to Growth
Tax History
| Year | Tax Paid | Tax Assessment Tax Assessment Total Assessment is a certain percentage of the fair market value that is determined by local assessors to be the total taxable value of land and additions on the property. | Land | Improvement |
|---|---|---|---|---|
| 2025 | $20,272 | $648,300 | $308,700 | $339,600 |
| 2024 | $19,650 | $648,300 | $308,700 | $339,600 |
| 2023 | $19,326 | $648,300 | $308,700 | $339,600 |
| 2022 | $19,326 | $648,300 | $308,700 | $339,600 |
| 2021 | $19,190 | $648,300 | $308,700 | $339,600 |
| 2020 | $19,105 | $648,300 | $308,700 | $339,600 |
| 2019 | $18,703 | $648,300 | $308,700 | $339,600 |
| 2018 | $18,360 | $648,300 | $308,700 | $339,600 |
| 2017 | $18,165 | $648,300 | $308,700 | $339,600 |
| 2016 | $13,019 | $478,300 | $308,700 | $169,600 |
| 2015 | $12,694 | $478,300 | $308,700 | $169,600 |
| 2014 | $12,402 | $478,300 | $308,700 | $169,600 |
Source: Public Records
Map
Nearby Homes
- 854 Cambridge Rd
- 820 Clauss Ln
- 258 Lynn St
- 86 Lincoln Terrace
- 803 Marshall Rd
- 794 Blauvelt St
- 4 Michelle Ct
- 30 Herring St
- 107 Parkway
- 8 Downing Place
- 21 Birchwood Rd
- 48 Flint Terrace
- 150 Tappan Rd
- 979 Blanch Ave
- 136 Tappan Rd
- 259 Collignon Way Unit 3A
- 271 Collignon Way
- 271 Collignon Way Unit 8B
- 271 Collignon Way Unit 4A
- 276 River Dr