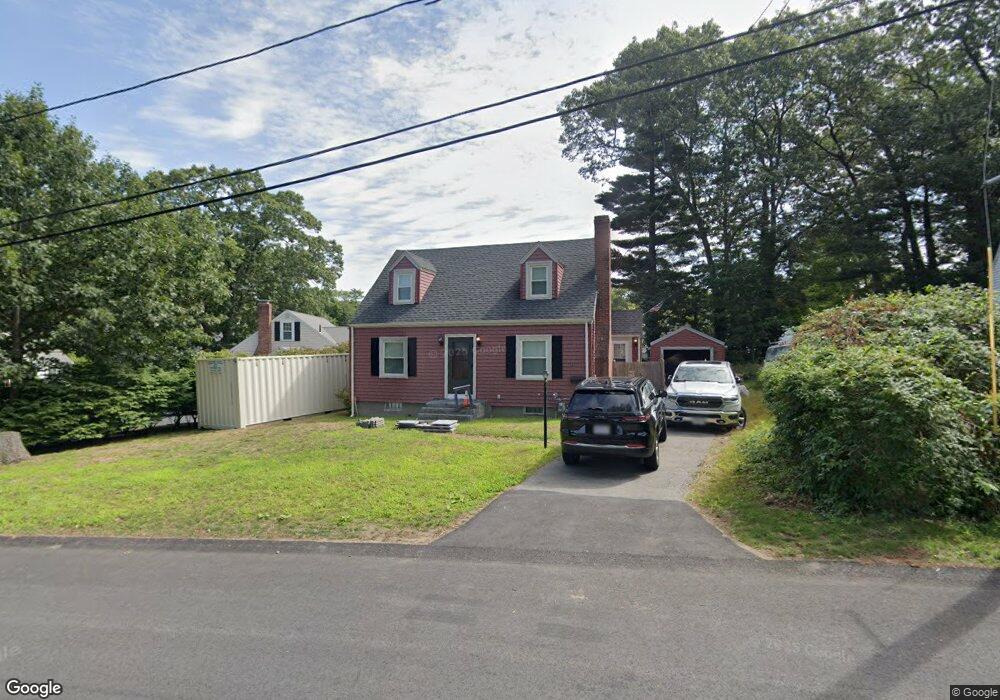
20 Belmont St Weymouth, MA 02188
South Weymouth NeighborhoodEstimated Value: $602,374 - $648,000
3
Beds
2
Baths
1,365
Sq Ft
$466/Sq Ft
Est. Value
About This Home
This home is located at 20 Belmont St, Weymouth, MA 02188 and is currently estimated at $635,844, approximately $465 per square foot. 20 Belmont St is a home located in Norfolk County with nearby schools including Frederick C Murphy, Abigail Adams Middle School, and Weymouth Middle School Chapman.
Ownership History
Date
Name
Owned For
Owner Type
Purchase Details
Closed on
Jul 1, 2003
Sold by
Tisi Carmelo L and Foley Linda
Bought by
Obrien Michael W and Obrien Lisa J
Current Estimated Value
Purchase Details
Closed on
Jun 2, 1994
Sold by
Aronson Jacqueline and Aronson Sasra
Bought by
Chan Wai K
Home Financials for this Owner
Home Financials are based on the most recent Mortgage that was taken out on this home.
Original Mortgage
$100,000
Interest Rate
8.49%
Mortgage Type
Purchase Money Mortgage
Create a Home Valuation Report for This Property
The Home Valuation Report is an in-depth analysis detailing your home's value as well as a comparison with similar homes in the area
Home Values in the Area
Average Home Value in this Area
Purchase History
| Date | Buyer | Sale Price | Title Company |
|---|---|---|---|
| Obrien Michael W | $317,500 | -- | |
| Chan Wai K | $223,000 | -- |
Source: Public Records
Mortgage History
| Date | Status | Borrower | Loan Amount |
|---|---|---|---|
| Previous Owner | Chan Wai K | $100,000 |
Source: Public Records
Tax History Compared to Growth
Tax History
| Year | Tax Paid | Tax Assessment Tax Assessment Total Assessment is a certain percentage of the fair market value that is determined by local assessors to be the total taxable value of land and additions on the property. | Land | Improvement |
|---|---|---|---|---|
| 2025 | $5,298 | $524,600 | $243,600 | $281,000 |
| 2024 | $5,131 | $499,600 | $232,000 | $267,600 |
| 2023 | $4,839 | $463,100 | $214,800 | $248,300 |
| 2022 | $4,553 | $397,300 | $182,400 | $214,900 |
| 2021 | $4,204 | $358,100 | $182,400 | $175,700 |
| 2020 | $4,044 | $339,300 | $182,400 | $156,900 |
| 2019 | $3,980 | $328,400 | $175,300 | $153,100 |
| 2018 | $3,896 | $311,700 | $167,000 | $144,700 |
| 2017 | $3,806 | $297,100 | $159,100 | $138,000 |
| 2016 | $3,657 | $285,700 | $152,900 | $132,800 |
| 2015 | $3,500 | $271,300 | $146,000 | $125,300 |
| 2014 | $3,298 | $248,000 | $135,900 | $112,100 |
Source: Public Records
Map
Nearby Homes
- 116 Belmont St
- 501 Commerce Dr Unit 2310
- 501 Commerce Dr Unit 1111
- 501 Commerce Dr Unit 4206
- 501 Commerce Dr Unit 4308
- 501 Commerce Dr Unit 4306
- 655 Summer St
- 200 Justin Dr Unit 3
- 255 West St
- 262 West St
- 92 Mercury St
- 432 Grove St
- 441 Grove St
- 48 Apple Tree Ln
- 54 Federal St
- 2 Tara Dr Unit 1
- 24 Blake Rd
- 972 Liberty St
- 67 Abby Rd
- 308 Forest St