Estimated Value: $330,934 - $416,000
3
Beds
2
Baths
1,975
Sq Ft
$189/Sq Ft
Est. Value
About This Home
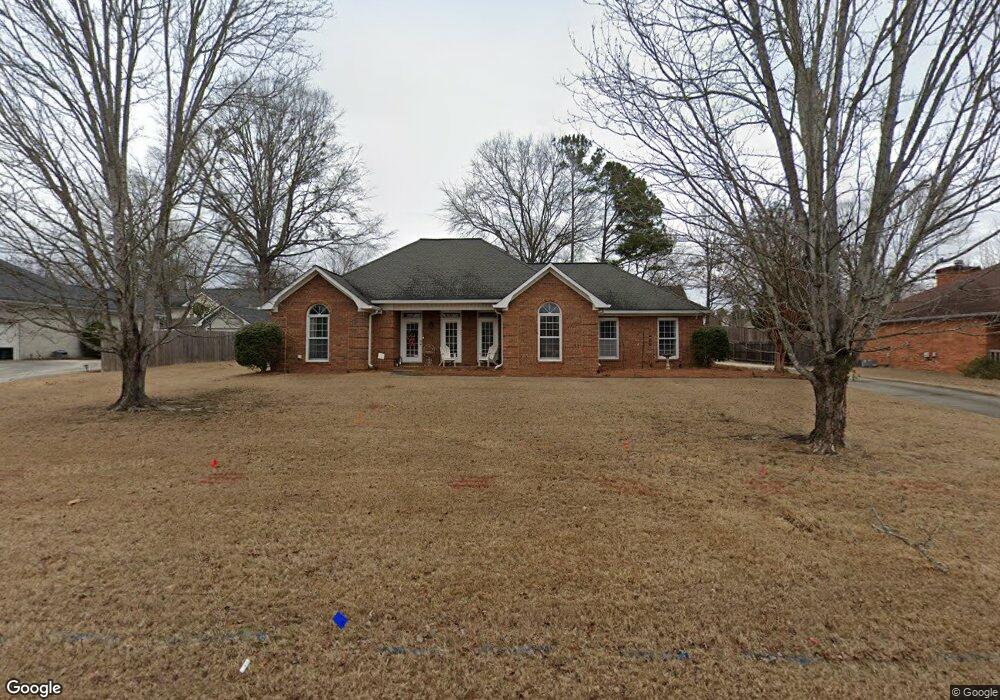
This home is located at 20 Bent Oak Trail NW, Rome, GA 30165 and is currently estimated at $373,984, approximately $189 per square foot. 20 Bent Oak Trail NW is a home located in Floyd County with nearby schools including Armuchee Middle School and Armuchee High School.
Ownership History
Date
Name
Owned For
Owner Type
Purchase Details
Closed on
Jul 21, 2014
Sold by
Hansard Larry T
Bought by
Hansard Benjamin W and Hansard Kimberly B
Current Estimated Value
Purchase Details
Closed on
May 30, 2014
Sold by
Campbell Christina B
Bought by
Hansard Larry T and Hansard Margaret E
Purchase Details
Closed on
Jul 9, 2004
Sold by
Brooks Christina S
Bought by
Campbell Christina B and Campbe Rex A
Purchase Details
Closed on
Jan 30, 1996
Sold by
Chittom Jim Harold and Chittom Jane
Bought by
Brooks Christina S
Purchase Details
Closed on
Aug 17, 1990
Sold by
Hardy Realty & Development
Bought by
Chittom Jim Harold and Chittom Jane
Purchase Details
Closed on
Mar 30, 1990
Sold by
Hardy Realty & Devl Et Al
Bought by
Hardy Realty & Development
Purchase Details
Closed on
Mar 2, 1989
Sold by
Burk William Jr Builders Inc & Citizens
Bought by
Hardy Realty & Devl Et Al
Purchase Details
Closed on
Oct 10, 1984
Bought by
Burk William Jr Builders Inc & Citizens
Create a Home Valuation Report for This Property
The Home Valuation Report is an in-depth analysis detailing your home's value as well as a comparison with similar homes in the area
Home Values in the Area
Average Home Value in this Area
Purchase History
| Date | Buyer | Sale Price | Title Company |
|---|---|---|---|
| Hansard Benjamin W | $132,000 | -- | |
| Hansard Larry T | $180,000 | -- | |
| Campbell Christina B | -- | -- | |
| Brooks Christina S | $141,000 | -- | |
| Chittom Jim Harold | $127,300 | -- | |
| Hardy Realty & Development | -- | -- | |
| Hardy Realty & Devl Et Al | -- | -- | |
| Burk William Jr Builders Inc & Citizens | -- | -- |
Source: Public Records
Tax History Compared to Growth
Tax History
| Year | Tax Paid | Tax Assessment Tax Assessment Total Assessment is a certain percentage of the fair market value that is determined by local assessors to be the total taxable value of land and additions on the property. | Land | Improvement |
|---|---|---|---|---|
| 2024 | $4,366 | $153,150 | $11,150 | $142,000 |
| 2023 | $4,363 | $142,051 | $9,757 | $132,294 |
| 2022 | $3,622 | $119,610 | $7,898 | $111,712 |
| 2021 | $2,998 | $96,970 | $7,898 | $89,072 |
| 2020 | $2,839 | $91,063 | $6,040 | $85,023 |
| 2019 | $2,422 | $78,544 | $6,040 | $72,504 |
| 2018 | $2,275 | $73,594 | $6,040 | $67,554 |
| 2017 | $2,167 | $69,861 | $6,040 | $63,821 |
| 2016 | $2,161 | $68,800 | $6,040 | $62,760 |
| 2015 | $2,137 | $69,120 | $6,040 | $63,080 |
| 2014 | $2,137 | $69,495 | $6,040 | $63,455 |
Source: Public Records
Map
Nearby Homes
- 14 Meadowood Dr NW
- 17 Ashley Oaks Trail NW
- 36 Bent Oak Trail NW
- 55 Hennon Dr NW
- 0 Dempsey St NW
- 45 Ashley Oaks Trail NW
- 63 Hennon Dr NW
- PEARSON Plan at Old Summerville Village
- 8 Silverbell Ln
- 4 Silverbell Ln
- 12 Silverbell Ln
- 10 Silverbell Ln
- 2 Palmer Dr NW
- 3858 Martha Berry Hwy NE
- 13&15 Crabapple Ln
- 13 & 15 Crabapple Ln NW
- 151 Lynn Dr NW
- 18 Bent Oak Trail NW
- 22 Bent Oak Trail NW
- 11 Meadowood Dr NW
- 9 Meadowood Dr NW
- 13 Meadowood Dr NW
- 7 Meadowood Dr NW
- 23 Bent Oak Trail NW
- 21 Bent Oak Trail NW
- 24 Bent Oak Trail NW
- 14 Bent Oak Trail NW
- 19 Bent Oak Trail NW
- 25 Bent Oak Trail NW
- 15 Meadowood Dr NW
- 5 Meadowood Dr NW
- 17 Bent Oak Trail NW
- 26 Bent Oak Trail NW
- 27 Bent Oak Trail NW
- 12 Meadowood Dr NW
- 10 Meadowood Dr NW
- 3 Meadowood Dr NW