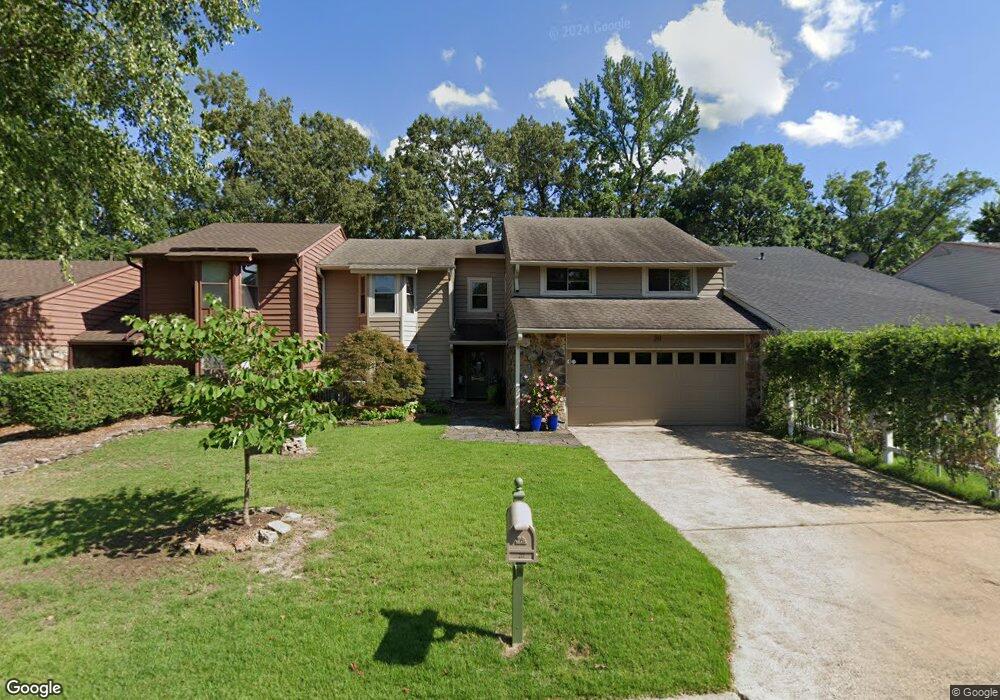
20 Birdie Loop Maumelle, AR 72113
Estimated Value: $322,000 - $376,000
3
Beds
3
Baths
2,902
Sq Ft
$122/Sq Ft
Est. Value
About This Home
This home is located at 20 Birdie Loop, Maumelle, AR 72113 and is currently estimated at $353,546, approximately $121 per square foot. 20 Birdie Loop is a home located in Pulaski County with nearby schools including Crystal Hill Elementary School, Maumelle Middle School, and Maumelle High School.
Ownership History
Date
Name
Owned For
Owner Type
Purchase Details
Closed on
Jan 31, 2020
Sold by
Rutledge Paula
Bought by
Rutledge Paula and The Paula A Rutledge Trust
Current Estimated Value
Purchase Details
Closed on
Feb 10, 2017
Sold by
Fannie Mae
Bought by
Rutledge Paula
Purchase Details
Closed on
Jul 27, 2016
Sold by
Citimortgage Inc
Bought by
Federal National Mortgage Association
Purchase Details
Closed on
Jul 12, 2016
Sold by
Deloney Jeff
Bought by
Citimortgage Inc
Purchase Details
Closed on
Mar 31, 2009
Sold by
Deloney Marva
Bought by
Deloney Jeff
Purchase Details
Closed on
Jun 28, 2002
Sold by
Kuykendall Clifford E
Bought by
Deloney Marva
Home Financials for this Owner
Home Financials are based on the most recent Mortgage that was taken out on this home.
Original Mortgage
$170,525
Interest Rate
6.89%
Mortgage Type
Purchase Money Mortgage
Create a Home Valuation Report for This Property
The Home Valuation Report is an in-depth analysis detailing your home's value as well as a comparison with similar homes in the area
Home Values in the Area
Average Home Value in this Area
Purchase History
| Date | Buyer | Sale Price | Title Company |
|---|---|---|---|
| Rutledge Paula | -- | None Available | |
| Rutledge Paula | $192,500 | Associates Closing & Title L | |
| Federal National Mortgage Association | -- | Attorney | |
| Citimortgage Inc | $140,565 | Attorney | |
| Deloney Jeff | -- | American Abstract & Title Co | |
| Deloney Marva | $180,000 | First American Title Ins Co |
Source: Public Records
Mortgage History
| Date | Status | Borrower | Loan Amount |
|---|---|---|---|
| Previous Owner | Deloney Marva | $170,525 |
Source: Public Records
Tax History Compared to Growth
Tax History
| Year | Tax Paid | Tax Assessment Tax Assessment Total Assessment is a certain percentage of the fair market value that is determined by local assessors to be the total taxable value of land and additions on the property. | Land | Improvement |
|---|---|---|---|---|
| 2025 | $3,078 | $58,942 | $9,200 | $49,742 |
| 2024 | $3,153 | $58,942 | $9,200 | $49,742 |
| 2023 | $3,153 | $58,942 | $9,200 | $49,742 |
| 2022 | $2,693 | $58,942 | $9,200 | $49,742 |
| 2021 | $2,866 | $45,560 | $8,100 | $37,460 |
| 2020 | $2,491 | $45,560 | $8,100 | $37,460 |
| 2019 | $2,491 | $45,560 | $8,100 | $37,460 |
| 2018 | $2,516 | $45,560 | $8,100 | $37,460 |
| 2017 | $2,516 | $45,560 | $8,100 | $37,460 |
| 2016 | $3,041 | $48,350 | $9,000 | $39,350 |
| 2015 | $3,041 | $48,350 | $9,000 | $39,350 |
| 2014 | $3,041 | $48,350 | $9,000 | $39,350 |
Source: Public Records
Map
Nearby Homes
- 20 Fairway Woods Cir
- 24 Fairway Woods Cir
- 15 Par Dr
- 7 Fairway Dr
- 101 Southshore Dr
- 6 Masters Place Dr
- 9 Shanna Ln
- 121 Lily Dr
- 32 Riverwood Cove
- 0 W Pointe Cul de Sac
- 119 Manitou Dr
- 394 Mountain Terrace Cir
- 393 Mountain Terrace Cir
- 40 Belle River Cir
- 167 Calais Dr
- 123 Mountain Terrace Cir
- 30 Belle River Cove
- 101 Verona Ln
- 205 Tivoli Ln
- 162 Mountain Terrace Cir
- 18 Birdie Loop
- 22 Birdie Loop
- 16 Birdie Loop
- 24 Birdie Loop
- 16 Sand Trap Dr
- 26 Birdie Loop
- 14 Birdie Loop
- 18 Sand Trap Dr
- 14 Sand Trap Dr
- 20 Sand Trap Dr
- 28 Birdie Loop
- 12 Birdie Loop
- 12 Sand Trap Dr
- 22 Sand Trap Dr
- 0 Birdie Loop
- 30 Birdie Loop
- 10 Birdie Loop
- 24 Sand Trap Dr
- 10 Sand Trap Dr
- 8 Birdie Loop