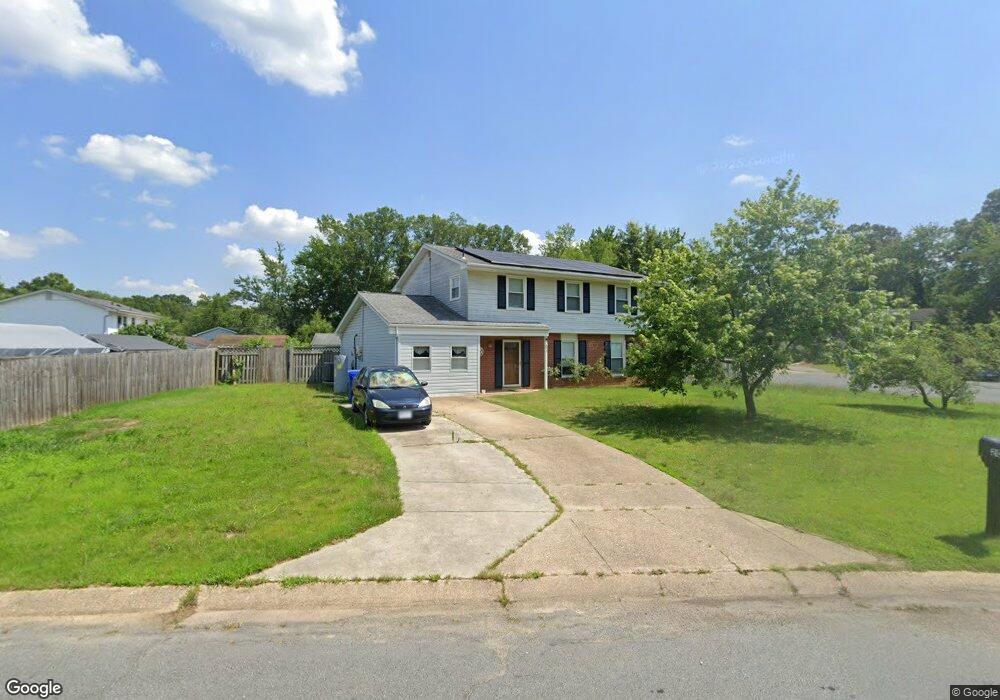
20 Blackpool Cir Waldorf, MD 20602
Estimated Value: $379,376 - $455,000
Studio
3
Baths
2,211
Sq Ft
$191/Sq Ft
Est. Value
About This Home
This home is located at 20 Blackpool Cir, Waldorf, MD 20602 and is currently estimated at $421,344, approximately $190 per square foot. 20 Blackpool Cir is a home located in Charles County with nearby schools including Dr. Gustavus Brown Elementary School, Benjamin Stoddert Middle School, and St. Charles High School.
Ownership History
Date
Name
Owned For
Owner Type
Purchase Details
Closed on
Jan 27, 2020
Sold by
Reamy John A and Reamy Barbara A
Bought by
Reamy John A and Reamy Amber Leigh
Current Estimated Value
Home Financials for this Owner
Home Financials are based on the most recent Mortgage that was taken out on this home.
Original Mortgage
$170,000
Outstanding Balance
$150,808
Interest Rate
3.7%
Mortgage Type
New Conventional
Estimated Equity
$270,536
Purchase Details
Closed on
Mar 9, 1987
Sold by
Hanbury Andrew T and Hanbury Elizabeth
Bought by
Reamy John A and Reamy Barbara
Home Financials for this Owner
Home Financials are based on the most recent Mortgage that was taken out on this home.
Original Mortgage
$81,000
Interest Rate
9.03%
Purchase Details
Closed on
Apr 30, 1982
Sold by
Tadle Ricardo A and Tadle Cecilia L
Bought by
Hanbury Andrew T and Hanbury Elizabeth
Home Financials for this Owner
Home Financials are based on the most recent Mortgage that was taken out on this home.
Original Mortgage
$23,828
Interest Rate
16.81%
Create a Home Valuation Report for This Property
The Home Valuation Report is an in-depth analysis detailing your home's value as well as a comparison with similar homes in the area
Home Values in the Area
Average Home Value in this Area
Purchase History
| Date | Buyer | Sale Price | Title Company |
|---|---|---|---|
| Reamy John A | -- | Cu Title Insurance Agcy Llc | |
| Reamy John A | $90,000 | -- | |
| Hanbury Andrew T | $26,900 | -- |
Source: Public Records
Mortgage History
| Date | Status | Borrower | Loan Amount |
|---|---|---|---|
| Open | Reamy John A | $170,000 | |
| Closed | Reamy John A | $81,000 | |
| Previous Owner | Hanbury Andrew T | $23,828 |
Source: Public Records
Tax History
| Year | Tax Paid | Tax Assessment Tax Assessment Total Assessment is a certain percentage of the fair market value that is determined by local assessors to be the total taxable value of land and additions on the property. | Land | Improvement |
|---|---|---|---|---|
| 2025 | $10,341 | $338,700 | -- | -- |
| 2024 | $4,503 | $322,400 | $125,000 | $197,400 |
| 2023 | $4,229 | $301,200 | $0 | $0 |
| 2022 | $3,918 | $280,000 | $0 | $0 |
| 2021 | $3,471 | $258,800 | $95,000 | $163,800 |
| 2020 | $3,471 | $246,633 | $0 | $0 |
| 2019 | $3,295 | $234,467 | $0 | $0 |
| 2018 | $2,578 | $222,300 | $90,000 | $132,300 |
| 2017 | $2,550 | $215,700 | $0 | $0 |
| 2016 | -- | $209,100 | $0 | $0 |
| 2015 | $2,946 | $202,500 | $0 | $0 |
| 2014 | $2,946 | $202,500 | $0 | $0 |
Source: Public Records
Map
Nearby Homes
- 6 Stratford Ct
- 3 Duncannon Rd
- 11613 Bardmoor Ct
- 5 Redcar Ct
- 9 Wicklow Ct
- 6 Castletown Ct
- 4646 Scottsdale Place
- 644 University Dr
- 228 Garner Ave
- 4773 Sheffield Cir
- 1404 Boswell Ct
- 2402 Ferrell Ct
- 2103 Gibbons Ct
- 1736 Brightwell Ct
- 209 Garner Ave
- 1210 Marshall Ln
- 5213 Vaughan Ct
- 137 Garner Ave
- 4640 Duley Dr
- 4665 Duley Dr
- 4 Stratford Ct
- 503 University Dr
- 505 University Dr
- 27 Blackpool Cir
- 501 University Dr
- 16 Blackpool Cir
- 8 Stratford Ct
- 25 Blackpool Cir
- 507 University Dr
- 504 University Dr
- 23 Blackpool Cir
- 5 Coniston Ct
- 14 Blackpool Cir
- 502 University Dr
- 509 University Dr
- 506 University Dr
- 7 Coniston Ct
- 500 University Dr
- 4 Ferbane Ct
- 3 Coniston Ct