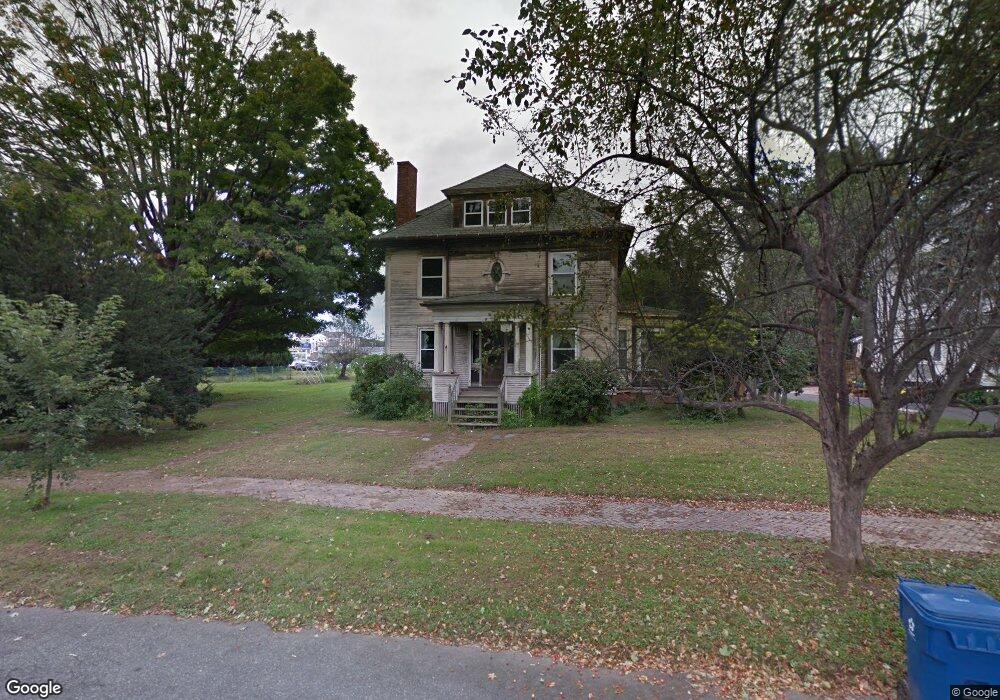
20 Bobskill Dr West Springfield, MA 01089
Estimated Value: $314,000 - $408,000
4
Beds
2
Baths
2,401
Sq Ft
$148/Sq Ft
Est. Value
About This Home
This home is located at 20 Bobskill Dr, West Springfield, MA 01089 and is currently estimated at $356,160, approximately $148 per square foot. 20 Bobskill Dr is a home located in Hampden County with nearby schools including Hampden Charter School of Science West.
Ownership History
Date
Name
Owned For
Owner Type
Purchase Details
Closed on
Apr 16, 2025
Sold by
Staves Susan
Bought by
Comfrey Rt and Staves
Current Estimated Value
Purchase Details
Closed on
Apr 12, 2023
Sold by
Taylor Geoffrey K
Bought by
Staves Susan
Purchase Details
Closed on
Apr 5, 2021
Sold by
Staves Susan
Bought by
Taylor Geoffrey K
Purchase Details
Closed on
Jul 17, 2020
Sold by
Bobskill William F and Bobskill Nancy
Bought by
Staves Susan
Purchase Details
Closed on
Jun 22, 2010
Sold by
Bobskill William F and Staves Susan L
Bought by
Staves Susan and Bobskill William F
Create a Home Valuation Report for This Property
The Home Valuation Report is an in-depth analysis detailing your home's value as well as a comparison with similar homes in the area
Home Values in the Area
Average Home Value in this Area
Purchase History
| Date | Buyer | Sale Price | Title Company |
|---|---|---|---|
| Comfrey Rt | -- | -- | |
| Staves Susan | -- | None Available | |
| Taylor Geoffrey K | -- | None Available | |
| Staves Susan | -- | None Available | |
| Staves Susan | -- | -- | |
| Staves Susan | -- | -- |
Source: Public Records
Tax History Compared to Growth
Tax History
| Year | Tax Paid | Tax Assessment Tax Assessment Total Assessment is a certain percentage of the fair market value that is determined by local assessors to be the total taxable value of land and additions on the property. | Land | Improvement |
|---|---|---|---|---|
| 2025 | $4,073 | $273,900 | $110,100 | $163,800 |
| 2024 | $3,969 | $268,000 | $110,100 | $157,900 |
| 2023 | $3,622 | $233,100 | $99,100 | $134,000 |
| 2022 | $3,292 | $208,900 | $89,900 | $119,000 |
| 2021 | $3,522 | $208,400 | $85,600 | $122,800 |
| 2020 | $3,537 | $208,200 | $85,600 | $122,600 |
| 2019 | $3,531 | $208,200 | $85,600 | $122,600 |
| 2018 | $3,550 | $208,200 | $85,600 | $122,600 |
| 2017 | $3,550 | $208,200 | $85,600 | $122,600 |
| 2016 | $3,486 | $205,200 | $82,600 | $122,600 |
| 2015 | $3,415 | $201,000 | $80,700 | $120,300 |
| 2014 | $3,298 | $201,000 | $80,700 | $120,300 |
Source: Public Records
Map
Nearby Homes