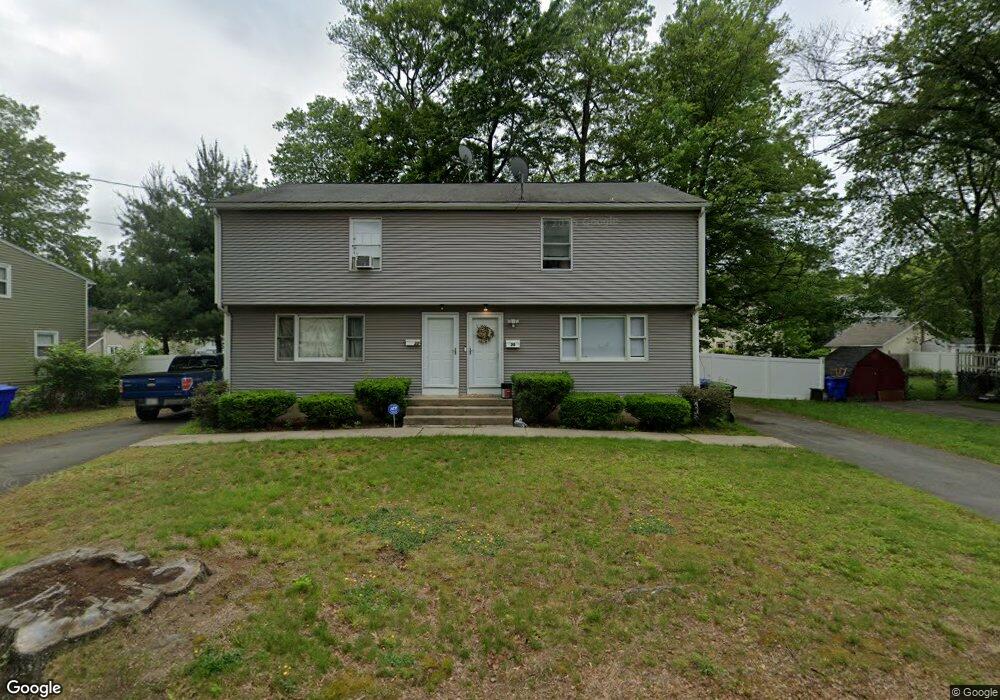
20 Bosworth St Unit 22 Springfield, MA 01108
Forest Park NeighborhoodEstimated Value: $345,818 - $429,000
6
Beds
4
Baths
2,279
Sq Ft
$170/Sq Ft
Est. Value
About This Home
This home is located at 20 Bosworth St Unit 22, Springfield, MA 01108 and is currently estimated at $387,455, approximately $170 per square foot. 20 Bosworth St Unit 22 is a home located in Hampden County with nearby schools including Washington Elementary School, M Marcus Kiley Middle, and High School Of Commerce.
Ownership History
Date
Name
Owned For
Owner Type
Purchase Details
Closed on
Dec 21, 1990
Sold by
Guimby Earl R
Bought by
Gaspari Michael G
Current Estimated Value
Home Financials for this Owner
Home Financials are based on the most recent Mortgage that was taken out on this home.
Original Mortgage
$122,068
Interest Rate
10.02%
Mortgage Type
Purchase Money Mortgage
Create a Home Valuation Report for This Property
The Home Valuation Report is an in-depth analysis detailing your home's value as well as a comparison with similar homes in the area
Home Values in the Area
Average Home Value in this Area
Purchase History
| Date | Buyer | Sale Price | Title Company |
|---|---|---|---|
| Gaspari Michael G | $147,000 | -- |
Source: Public Records
Mortgage History
| Date | Status | Borrower | Loan Amount |
|---|---|---|---|
| Closed | Gaspari Michael G | $124,518 | |
| Closed | Gaspari Michael G | $122,068 | |
| Previous Owner | Gaspari Michael G | $100,000 |
Source: Public Records
Tax History
| Year | Tax Paid | Tax Assessment Tax Assessment Total Assessment is a certain percentage of the fair market value that is determined by local assessors to be the total taxable value of land and additions on the property. | Land | Improvement |
|---|---|---|---|---|
| 2025 | $4,822 | $307,500 | $39,300 | $268,200 |
| 2024 | $4,897 | $304,900 | $39,300 | $265,600 |
| 2023 | $4,595 | $269,500 | $37,500 | $232,000 |
| 2022 | $4,507 | $239,500 | $37,500 | $202,000 |
| 2021 | $4,234 | $224,000 | $34,100 | $189,900 |
| 2020 | $3,990 | $204,300 | $34,100 | $170,200 |
| 2019 | $3,601 | $183,000 | $34,100 | $148,900 |
| 2018 | $3,273 | $166,300 | $34,100 | $132,200 |
| 2017 | $3,275 | $166,600 | $34,100 | $132,500 |
| 2016 | $3,120 | $158,700 | $34,100 | $124,600 |
| 2015 | $3,129 | $159,100 | $34,100 | $125,000 |
Source: Public Records
Map
Nearby Homes
- 26 Dwight Rd
- 22 Eleanor Rd
- 88 Brunswick St
- 33-35 Ruskin St
- 914-916 Belmont Ave
- 77 Dorset St
- 83 Gilman St
- 51-53 Eloise St
- 46 Eckington St
- 86 Belvidere St
- 78 Wood Ave
- 13 Bither St
- 163 Powell Ave
- 1088 Sumner Ave
- 114 Sylvan St Unit 116
- 854-856 Sumner Ave
- 134-136 Woodlawn St
- 144 Washington St
- 35 Carlton St
- 67 Perkins St
Your Personal Tour Guide
Ask me questions while you tour the home.