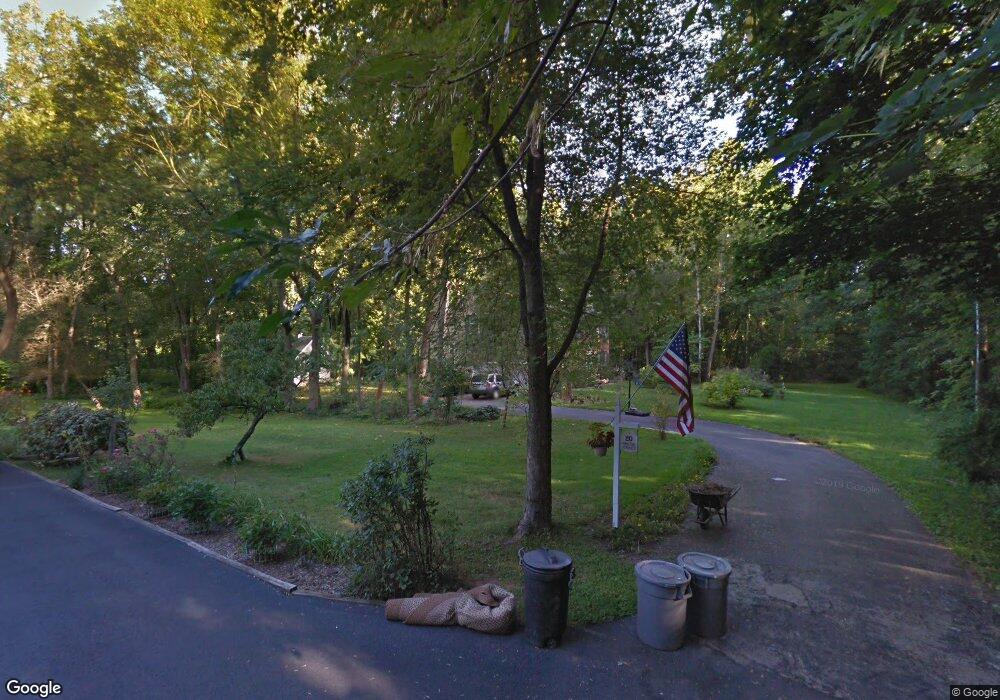
20 Bridge St Rancocas, NJ 08073
Estimated Value: $307,000 - $666,000
--
Bed
--
Bath
2,896
Sq Ft
$170/Sq Ft
Est. Value
About This Home
This home is located at 20 Bridge St, Rancocas, NJ 08073 and is currently estimated at $492,659, approximately $170 per square foot. 20 Bridge St is a home with nearby schools including Holly Hills Elementary School, Westampton Intermediate School, and Rancocas Valley Regional High School.
Ownership History
Date
Name
Owned For
Owner Type
Purchase Details
Closed on
Jul 27, 2001
Sold by
Pinho Fernando
Bought by
Banister John E and Banister Suzanne V
Current Estimated Value
Home Financials for this Owner
Home Financials are based on the most recent Mortgage that was taken out on this home.
Original Mortgage
$188,000
Interest Rate
6.99%
Purchase Details
Closed on
Jun 13, 2000
Sold by
Silva Albino and Cruz Antonio
Bought by
Pinho Fernando
Create a Home Valuation Report for This Property
The Home Valuation Report is an in-depth analysis detailing your home's value as well as a comparison with similar homes in the area
Home Values in the Area
Average Home Value in this Area
Purchase History
| Date | Buyer | Sale Price | Title Company |
|---|---|---|---|
| Banister John E | $264,900 | Surety Title Corporation | |
| Pinho Fernando | -- | First American Title Ins Co |
Source: Public Records
Mortgage History
| Date | Status | Borrower | Loan Amount |
|---|---|---|---|
| Previous Owner | Banister John E | $188,000 |
Source: Public Records
Tax History Compared to Growth
Tax History
| Year | Tax Paid | Tax Assessment Tax Assessment Total Assessment is a certain percentage of the fair market value that is determined by local assessors to be the total taxable value of land and additions on the property. | Land | Improvement |
|---|---|---|---|---|
| 2025 | $9,590 | $341,400 | $91,200 | $250,200 |
| 2024 | $9,228 | $341,400 | $91,200 | $250,200 |
| 2023 | $9,228 | $341,400 | $91,200 | $250,200 |
| 2022 | $8,767 | $341,400 | $91,200 | $250,200 |
| 2021 | $8,443 | $341,400 | $91,200 | $250,200 |
| 2020 | $8,409 | $341,400 | $91,200 | $250,200 |
| 2019 | $8,238 | $341,400 | $91,200 | $250,200 |
| 2018 | $8,132 | $341,400 | $91,200 | $250,200 |
| 2017 | $7,917 | $341,400 | $91,200 | $250,200 |
| 2016 | $7,770 | $341,400 | $91,200 | $250,200 |
| 2015 | $7,620 | $341,400 | $91,200 | $250,200 |
| 2014 | $7,425 | $341,400 | $91,200 | $250,200 |
Source: Public Records
Map
Nearby Homes