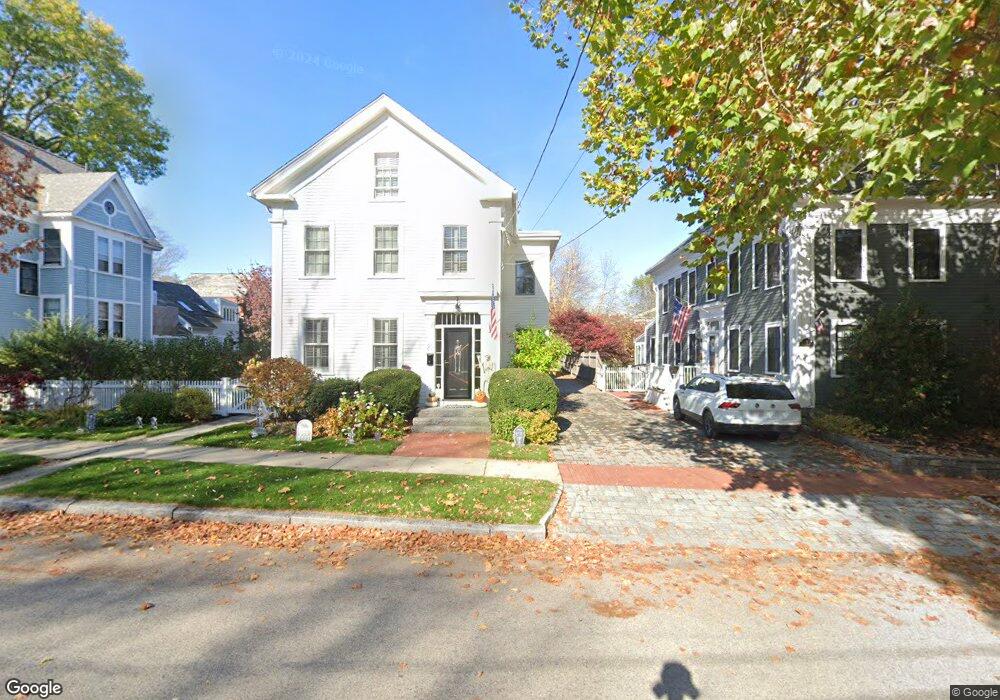
20 Broad St Newburyport, MA 01950
Estimated Value: $1,799,000 - $2,010,000
5
Beds
3
Baths
3,036
Sq Ft
$625/Sq Ft
Est. Value
About This Home
This home is located at 20 Broad St, Newburyport, MA 01950 and is currently estimated at $1,896,229, approximately $624 per square foot. 20 Broad St is a home located in Essex County with nearby schools including Francis T. Bresnahan Elementary School, Edward G. Molin Elementary School, and Rupert A. Nock Middle School.
Ownership History
Date
Name
Owned For
Owner Type
Purchase Details
Closed on
Jul 15, 2016
Sold by
Boyd Andrew C and Boyd Laura W
Bought by
Macdonald Glenn and Macdonald Kerrie
Current Estimated Value
Home Financials for this Owner
Home Financials are based on the most recent Mortgage that was taken out on this home.
Original Mortgage
$200,000
Outstanding Balance
$90,990
Interest Rate
3.66%
Mortgage Type
New Conventional
Estimated Equity
$1,805,239
Purchase Details
Closed on
Aug 8, 2008
Sold by
Adams Andrea M and Adams Bret W
Bought by
Boyd Andrew C and Boyd Laura W
Purchase Details
Closed on
Sep 2, 2003
Sold by
Arthur David T and Arthur Pamela W
Bought by
Adams Bret W
Purchase Details
Closed on
May 6, 1994
Sold by
Serwon Frank and Serwon Dorothy A
Bought by
Arthur David T and Arthur Pamela
Create a Home Valuation Report for This Property
The Home Valuation Report is an in-depth analysis detailing your home's value as well as a comparison with similar homes in the area
Home Values in the Area
Average Home Value in this Area
Purchase History
| Date | Buyer | Sale Price | Title Company |
|---|---|---|---|
| Macdonald Glenn | $950,000 | -- | |
| Boyd Andrew C | $720,000 | -- | |
| Adams Bret W | $779,000 | -- | |
| Arthur David T | $175,000 | -- |
Source: Public Records
Mortgage History
| Date | Status | Borrower | Loan Amount |
|---|---|---|---|
| Open | Macdonald Glenn | $200,000 | |
| Previous Owner | Arthur David T | $465,000 | |
| Previous Owner | Arthur David T | $127,000 |
Source: Public Records
Tax History Compared to Growth
Tax History
| Year | Tax Paid | Tax Assessment Tax Assessment Total Assessment is a certain percentage of the fair market value that is determined by local assessors to be the total taxable value of land and additions on the property. | Land | Improvement |
|---|---|---|---|---|
| 2025 | $14,713 | $1,535,800 | $456,600 | $1,079,200 |
| 2024 | $13,967 | $1,400,900 | $415,100 | $985,800 |
| 2023 | $14,464 | $1,346,700 | $360,900 | $985,800 |
| 2022 | $13,699 | $1,140,600 | $300,700 | $839,900 |
| 2021 | $13,181 | $1,042,800 | $273,400 | $769,400 |
| 2020 | $12,948 | $1,008,400 | $273,400 | $735,000 |
| 2019 | $12,490 | $954,900 | $273,400 | $681,500 |
| 2018 | $11,898 | $897,300 | $260,500 | $636,800 |
| 2017 | $11,492 | $854,400 | $248,100 | $606,300 |
| 2016 | $11,144 | $832,300 | $226,000 | $606,300 |
| 2015 | $10,436 | $782,300 | $226,000 | $556,300 |
Source: Public Records
Map
Nearby Homes
- 13 Broad St
- 27 Warren St Unit 1
- 288 Merrimac St
- 266 Merrimac St Unit F
- 158 Merrimac St Unit 3
- 45 Boardman St Unit 1
- 126 Merrimac St Unit 35
- 287 1/2 High St
- 41 Washington St Unit B
- 44 Washington St Unit C
- 14 Dexter Ln Unit B
- 14 Dexter Ln Unit A
- 58 Merrimac St Unit 2-5
- 110 Low St
- 138 Low St
- 2 Court St Unit 4
- 175 Bridge Rd
- 10 10th St
- 1 Hill St
- 1 Hill St Unit 1