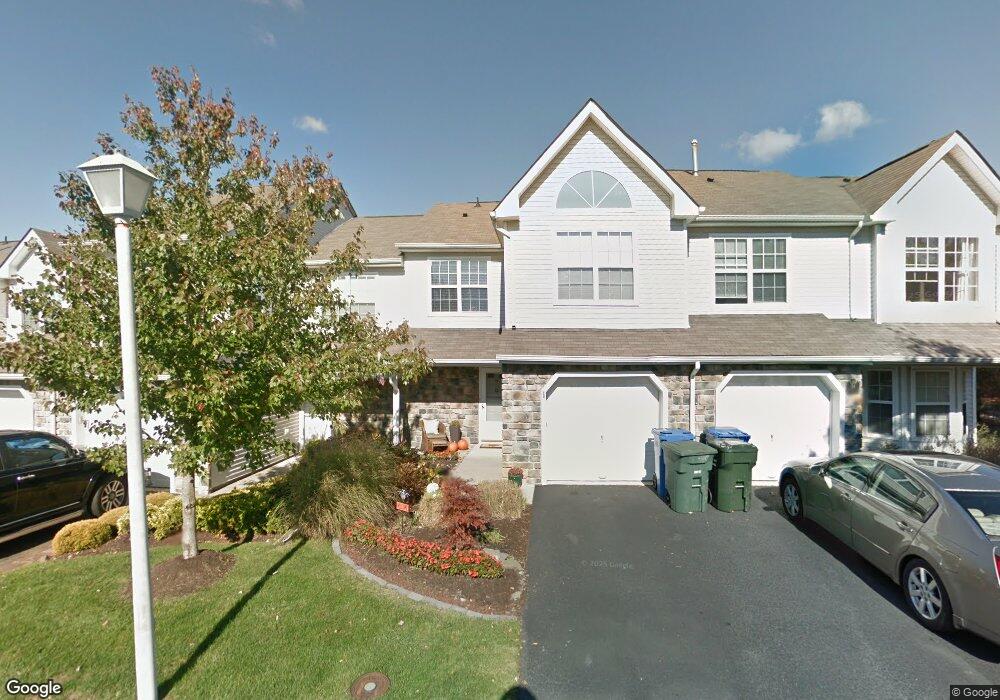
20 Buford Ct Tinton Falls, NJ 07753
Estimated Value: $455,000 - $485,000
2
Beds
1
Bath
1,521
Sq Ft
$310/Sq Ft
Est. Value
About This Home
This home is located at 20 Buford Ct, Tinton Falls, NJ 07753 and is currently estimated at $471,585, approximately $310 per square foot. 20 Buford Ct is a home located in Monmouth County with nearby schools including Mahala F. Atchinson Elementary School, Swimming River Elementary School, and Tinton Falls Middle School.
Ownership History
Date
Name
Owned For
Owner Type
Purchase Details
Closed on
Jun 12, 2018
Sold by
Betty Fish Credit Shelter Trust
Bought by
Fish Family Irrevocable Trust and Fish Charles A
Current Estimated Value
Purchase Details
Closed on
Aug 13, 2015
Sold by
Estate Of Betty Fish and Fish Thomas R
Bought by
Betty Fish Credit Shelter Trust and Scher Elaine J
Purchase Details
Closed on
Mar 13, 2001
Sold by
Nutmeg Dev Corp
Bought by
Fish Betty
Create a Home Valuation Report for This Property
The Home Valuation Report is an in-depth analysis detailing your home's value as well as a comparison with similar homes in the area
Home Values in the Area
Average Home Value in this Area
Purchase History
| Date | Buyer | Sale Price | Title Company |
|---|---|---|---|
| Fish Family Irrevocable Trust | -- | None Available | |
| Betty Fish Credit Shelter Trust | -- | Attorney | |
| Fish Betty | $155,750 | -- |
Source: Public Records
Tax History Compared to Growth
Tax History
| Year | Tax Paid | Tax Assessment Tax Assessment Total Assessment is a certain percentage of the fair market value that is determined by local assessors to be the total taxable value of land and additions on the property. | Land | Improvement |
|---|---|---|---|---|
| 2025 | $6,145 | $474,800 | $242,000 | $232,800 |
| 2024 | $5,924 | $427,000 | $199,500 | $227,500 |
| 2023 | $5,924 | $388,200 | $165,000 | $223,200 |
| 2022 | $5,738 | $355,000 | $135,000 | $220,000 |
| 2021 | $5,738 | $297,900 | $120,000 | $177,900 |
| 2020 | $5,606 | $281,000 | $105,000 | $176,000 |
| 2019 | $5,522 | $277,200 | $100,000 | $177,200 |
| 2018 | $5,357 | $268,100 | $95,000 | $173,100 |
| 2017 | $5,426 | $264,800 | $95,000 | $169,800 |
| 2016 | $5,399 | $257,600 | $90,000 | $167,600 |
| 2015 | $5,386 | $260,200 | $95,000 | $165,200 |
| 2014 | $5,388 | $249,000 | $75,000 | $174,000 |
Source: Public Records
Map
Nearby Homes
- 18 Buford Ct
- 22 Buford Ct
- 16 Buford Ct
- 24 Buford Ct Unit 12
- 14 Buford Ct
- 12 Buford Ct
- 26 Buford Ct
- 10 Buford Ct Unit 5
- 28 Buford Ct
- 8 Buford Ct
- 30 Buford Ct
- 6 Buford Ct Unit 3
- 43 Horseshoe Ct Unit 42
- 41 Horseshoe Ct Unit 41
- 34 Buford Ct
- 37 Horseshoe Ct
- 45 Horseshoe Ct
- 4 Buford Ct Unit 2
- 47 Horseshoe Ct
- 35 Horseshoe Ct