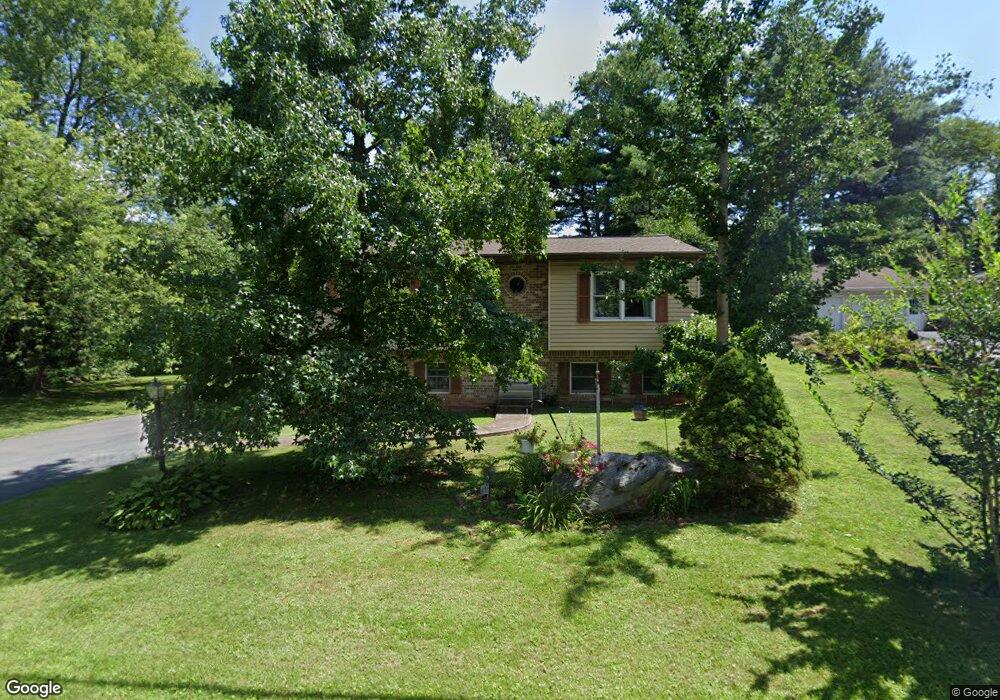
20 Bunker Ln Etters, PA 17319
Estimated Value: $254,000 - $312,000
3
Beds
2
Baths
1,660
Sq Ft
$175/Sq Ft
Est. Value
About This Home
This home is located at 20 Bunker Ln, Etters, PA 17319 and is currently estimated at $290,421, approximately $174 per square foot. 20 Bunker Ln is a home located in York County with nearby schools including Red Mill Elementary School, Crossroads Middle School, and Red Land Senior High School.
Ownership History
Date
Name
Owned For
Owner Type
Purchase Details
Closed on
Dec 10, 2008
Sold by
Hsbc Mortgage Services Inc
Bought by
Brewer Shawn L
Current Estimated Value
Home Financials for this Owner
Home Financials are based on the most recent Mortgage that was taken out on this home.
Original Mortgage
$127,806
Outstanding Balance
$85,023
Interest Rate
6.27%
Mortgage Type
FHA
Estimated Equity
$205,398
Purchase Details
Closed on
Sep 22, 2008
Sold by
Myers Randy L
Bought by
Hsbc Mortgage Services Inc
Purchase Details
Closed on
Nov 18, 2005
Sold by
Foor E Dell and Foor Lorna M
Bought by
Myers Randy L
Home Financials for this Owner
Home Financials are based on the most recent Mortgage that was taken out on this home.
Original Mortgage
$169,900
Interest Rate
8.96%
Mortgage Type
Fannie Mae Freddie Mac
Create a Home Valuation Report for This Property
The Home Valuation Report is an in-depth analysis detailing your home's value as well as a comparison with similar homes in the area
Home Values in the Area
Average Home Value in this Area
Purchase History
| Date | Buyer | Sale Price | Title Company |
|---|---|---|---|
| Brewer Shawn L | $128,500 | None Available | |
| Hsbc Mortgage Services Inc | $2,271 | None Available | |
| Myers Randy L | $169,900 | None Available |
Source: Public Records
Mortgage History
| Date | Status | Borrower | Loan Amount |
|---|---|---|---|
| Open | Brewer Shawn L | $127,806 | |
| Previous Owner | Myers Randy L | $169,900 |
Source: Public Records
Tax History Compared to Growth
Tax History
| Year | Tax Paid | Tax Assessment Tax Assessment Total Assessment is a certain percentage of the fair market value that is determined by local assessors to be the total taxable value of land and additions on the property. | Land | Improvement |
|---|---|---|---|---|
| 2025 | $3,453 | $124,630 | $35,420 | $89,210 |
| 2024 | $4,513 | $124,630 | $35,420 | $89,210 |
| 2023 | $3,086 | $124,630 | $35,420 | $89,210 |
| 2022 | $3,077 | $124,630 | $35,420 | $89,210 |
| 2021 | $2,899 | $124,630 | $35,420 | $89,210 |
| 2020 | $2,865 | $124,630 | $35,420 | $89,210 |
| 2019 | $2,792 | $124,630 | $35,420 | $89,210 |
| 2018 | $2,770 | $124,630 | $35,420 | $89,210 |
| 2017 | $2,695 | $124,630 | $35,420 | $89,210 |
| 2016 | $0 | $124,630 | $35,420 | $89,210 |
| 2015 | -- | $124,630 | $35,420 | $89,210 |
| 2014 | -- | $124,630 | $35,420 | $89,210 |
Source: Public Records
Map
Nearby Homes
- 25 Mulligan Dr
- 10 Fargreen Ct Unit 1E
- 30 Highland Cir
- 60 S Ben Hogan Dr
- 300 Juniper Dr
- 244 Juniper Dr
- 200 Juniper Dr
- 25 Killinger Rd
- Lot 50 Scarlet Oak Dr
- Lot 49 Scarlet Oak Dr
- Lot 48 Scarlet Oak Dr
- Lot 47 Scarlet Oak Dr
- Lot 46 Scarlet Oak Dr
- Lot 29 Scarlet Oak Dr
- Lot 45 Scarlet Oak Dr
- 15 Winterberry Ln
- 5 Winterberry Ln
- 0 Vista Cir
- 28 White Dogwood Dr
- 209 Church Rd