NOT LISTED FOR SALE

20 Cabot St Bellingham, MA 02019

Estimated Value: $420,000 - $567,000

3 Beds
1 Bath
1,694 Sq Ft
$289/Sq Ft Est. Value

Last Sold May 23, 2013

Last sale price $200,000 $118 Per Sq Ft

Est. 145% increase in value since last sale

Current estimated payment $3,097/month

7 Days on Market

Highlights

  • Cape Cod Architecture
  • Corner Lot
  • Thermal Windows
  • Wood Flooring
  • 1 Car Detached Garage
  • Public Transportation

About This Home

As of May 2013

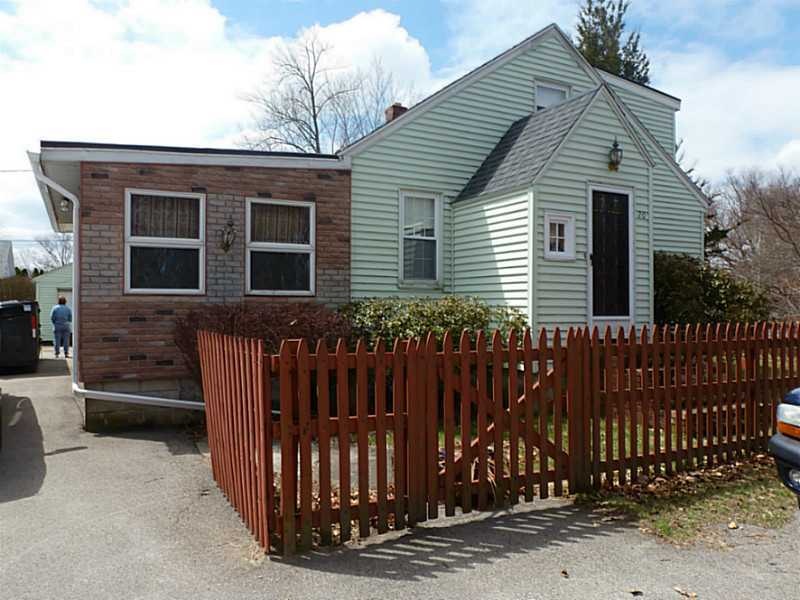
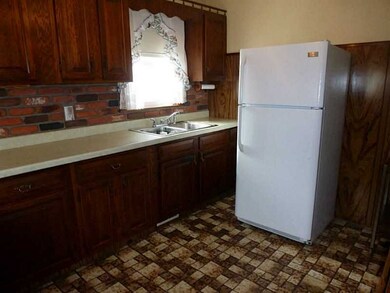
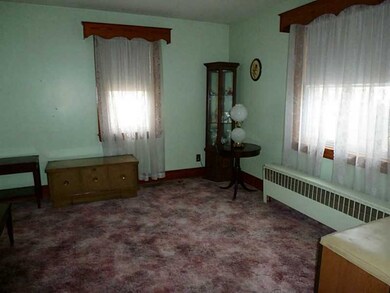
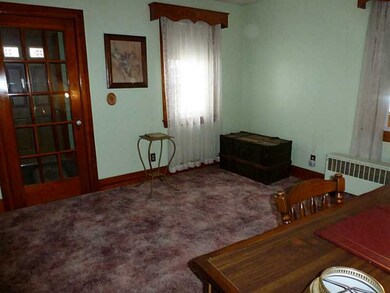
THIS CAPE IS A HIDDEN TREASURE ON A LARGE CORNER LOT ON DEAD END STREET. OFFERS SPACE, NEW WINDOWS & ROOF. HARDWOODS AND CONVENIENCE. JUST NEEDS YOUR TOUCH TO MAKE IT HOME!

Last Agent to Sell the Property

Michele Cerreta

Coldwell Banker Realty License #RES.0027876 Listed on: 04/15/2013

Coldwell Banker Realty

Last Buyer's Agent

Dorothea Goulet

CrossRoads Real Estate Group License #RES.0032669

Home Details

Home Type

  • Single Family

Est. Annual Taxes

  • $3,316

Year Built

  • Built in 1948

Lot Details

  • 0.28 Acre Lot
  • Fenced
  • Corner Lot

Parking

  • 1 Car Detached Garage
  • Driveway

Home Design

  • Cape Cod Architecture
  • Vinyl Siding

Interior Spaces

  • 1,694 Sq Ft Home
  • 2-Story Property
  • Stone Fireplace
  • Thermal Windows
  • Partially Finished Basement
  • Basement Fills Entire Space Under The House
  • Storm Doors

Kitchen

  • Oven
  • Range
  • Microwave

Flooring

  • Wood
  • Carpet
  • Laminate

Bedrooms and Bathrooms

  • 3 Bedrooms
  • 1 Full Bathroom

Laundry

  • Dryer
  • Washer

Utilities

  • Forced Air Heating and Cooling System
  • Heating System Uses Oil
  • 100 Amp Service
  • Oil Water Heater
  • Septic Tank

Listing and Financial Details

  • Tax Lot 64
  • Assessor Parcel Number 20CABOTSTBELL

Community Details

Overview

  • Bellingham Subdivision

Amenities

  • Shops
  • Public Transportation

Home Details

Home Type

Single Family

Est. Annual Taxes

$3,316

Year Built

Built in 1948

Lot Details

0

Parking

1

Listing Details

  • Property Sub Type: Single Family Residence
  • Prop. Type: Residential
  • Lot Size Acres: 0.2755
  • Subdivision Name: BELLINGHAM
  • Above Grade Finished Sq Ft: 1694.0
  • Architectural Style: Cape Cod
  • Garage Yn: Yes
  • Unit Levels: Two
  • New Construction: No
  • Building Stories: 2
  • Year Built: 1948
  • Property Sub Type Additional: Single Family Residence
  • Special Features: None
  • Stories: 2

Interior Features

  • Appliances: Dryer, Microwave, Oven, Oil Water Heater, Range, Refrigerator, Washer
  • Has Basement: Full, Partially Finished
  • Basement YN: Yes
  • Full Bathrooms: 1
  • Total Bedrooms: 3
  • Door Features: Storm Door(s)
  • Fireplace Features: Stone
  • Fireplace: No
  • Flooring: Carpet, Hardwood, Laminate
  • Living Area: 1694.0
  • Stories: 2
  • Window Features: Thermal Windows
  • ResoLivingAreaSource: PublicRecords

Exterior Features

  • Fencing: Fenced
  • Lot Features: Corner Lot
  • Construction Type: Vinyl Siding
  • Exterior Features: Paved Driveway

Garage/Parking

  • Attached Garage: No
  • Covered Parking Spaces: 1.0
  • Garage Spaces: 1.0
  • Parking Features: Detached, Garage
  • Total Parking Spaces: 1.0

Utilities

  • Cooling: Central Air
  • Cooling Y N: Yes
  • Heating: Forced Air, Oil
  • Heating Yn: Yes
  • Electric: 100 Amp Service, Circuit Breakers
  • Sewer: Septic Tank
  • Water Source: Connected

Condo/Co-op/Association

  • Community Features: Public Transportation, Shopping
  • Senior Community: No

Lot Info

  • Lot Size Sq Ft: 12000.0
  • Parcel #: 20CABOTSTBELL
  • ResoLotSizeUnits: SquareFeet

Tax Info

  • Tax Annual Amount: 3316.0
  • Tax Lot: 64
  • Tax Year: 2013

Range of Values:

Collateral Analytics

Collateral Analytics Collateral Analytics AVMs (Automated Valuation Model) employ a number of statistical approaches combined with neighborhood-specific comparable selection guarantees the most up-to-date and precise valuations.

Not Available

Collateral Analytics does not have data for the current month. Please view the chart for historical values.

ICE

ICE Mortgage Technology ICE Mortgage Technology’s AVM (Automated Valuation Model) is a state-of-the-art online residential property valuation tool that provides a quick and accurate estimate of the value of almost any home in the U.S.

Not Available

ICE Mortgage Technology does not have data for the current month. Please view the chart for historical values.

First American

First American First American Data & Analytics’ next-generation AVM combines unrivaled data assets with a blended ensemble of valuation models to produce highly accurate, reliable valuations you can trust.

Not Available

First American does not have data for the current month. Please view the chart for historical values.

Quantarium

Quantarium Quantarium’s valuation service, repeatedly proven the industry’s most accurate and comprehensive, is supercharged with a self-learning and auto-tuning AI engine that continually becomes smarter and more accurate as it processes daily inputs from the industry’s leading RE data lake.

Not Available

Quantarium does not have data for the current month. Please view the chart for historical values.

Average Value
Not Available
List Price
Sold Price
Create a Home Valuation Report for This Property
The Home Valuation Report is an in-depth analysis detailing your home's value as well as a comparison with similar homes in the area

Home Values in the Area

Source: Public Records

Average Home Value in this Area


Source: Public Records

Property History

Date Event Price Change Sq Ft Price
05/23/2013 05/23/13 Sold $200,000 -9.1% $118 / Sq Ft
04/23/2013 04/23/13 Pending -- -- --
04/15/2013 04/15/13 For Sale $220,000 -- $130 / Sq Ft
Source: State-Wide MLS

Tax History Compared to Growth

Source: Public Records

Tax History

Year Tax Paid Tax Assessment Tax Assessment Total Assessment is a certain percentage of the fair market value that is determined by local assessors to be the total taxable value of land and additions on the property. Land Improvement
2025 $5,151 $410,100 $125,000 $285,100
2024 $4,906 $381,500 $114,200 $267,300
2023 $4,728 $362,300 $108,700 $253,600
2022 $4,318 $306,700 $90,700 $216,000
2021 $4,163 $288,900 $90,700 $198,200
2020 $3,955 $278,100 $90,700 $187,400
2019 $3,876 $272,800 $90,700 $182,100
2018 $3,611 $250,600 $88,200 $162,400
2017 $3,531 $246,200 $88,200 $158,000
2016 $3,284 $229,800 $90,500 $139,300
2015 $3,122 $219,100 $87,700 $131,400
2014 $3,263 $222,600 $92,400 $130,200
Source: Public Records

Agents Affiliated with this Home

  • Section Image
  • Section Image
See All Agents

Map

Source: State-Wide MLS

MLS Number: 1038358

State-Wide MLS

APN: BELL-000098-000064