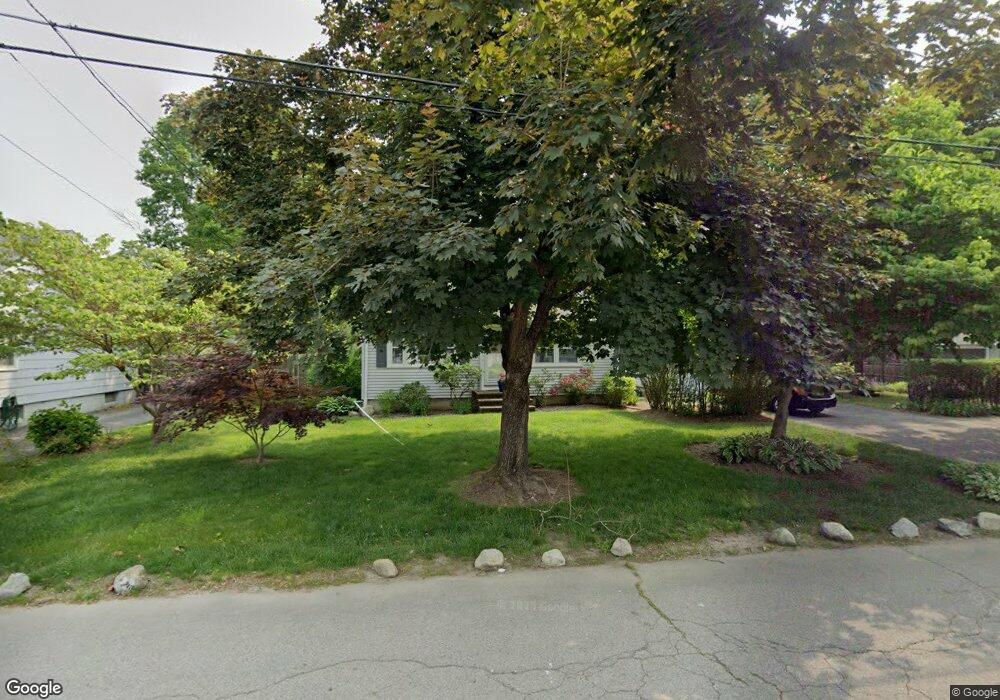
20 Cambo St Brockton, MA 02301
Clifton Heights NeighborhoodEstimated Value: $463,000 - $498,000
3
Beds
1
Bath
1,162
Sq Ft
$411/Sq Ft
Est. Value
About This Home
This home is located at 20 Cambo St, Brockton, MA 02301 and is currently estimated at $477,132, approximately $410 per square foot. 20 Cambo St is a home located in Plymouth County with nearby schools including Gilmore Elementary School, John F. Kennedy Elementary School, and Davis K-8 School.
Ownership History
Date
Name
Owned For
Owner Type
Purchase Details
Closed on
Nov 30, 2000
Sold by
Sullivan Michael F and Sullivan Maria L
Bought by
Davenport Richard W
Current Estimated Value
Purchase Details
Closed on
Jan 27, 1993
Sold by
Fhlmc
Bought by
Sullivan Michael F and Sullivan Maria L
Purchase Details
Closed on
Jan 8, 1993
Sold by
Durante Diane C and Fedl Home Ln Mtg Cp
Bought by
Fhlmc
Purchase Details
Closed on
Nov 24, 1987
Sold by
Monaghan Thomas
Bought by
Durante Peter R
Create a Home Valuation Report for This Property
The Home Valuation Report is an in-depth analysis detailing your home's value as well as a comparison with similar homes in the area
Home Values in the Area
Average Home Value in this Area
Purchase History
| Date | Buyer | Sale Price | Title Company |
|---|---|---|---|
| Davenport Richard W | $154,900 | -- | |
| Sullivan Michael F | $71,000 | -- | |
| Fhlmc | $108,449 | -- | |
| Durante Peter R | $123,000 | -- |
Source: Public Records
Mortgage History
| Date | Status | Borrower | Loan Amount |
|---|---|---|---|
| Open | Durante Peter R | $202,246 | |
| Closed | Durante Peter R | $40,000 |
Source: Public Records
Tax History Compared to Growth
Tax History
| Year | Tax Paid | Tax Assessment Tax Assessment Total Assessment is a certain percentage of the fair market value that is determined by local assessors to be the total taxable value of land and additions on the property. | Land | Improvement |
|---|---|---|---|---|
| 2025 | $4,613 | $380,900 | $148,200 | $232,700 |
| 2024 | $4,410 | $366,900 | $148,200 | $218,700 |
| 2023 | $4,625 | $356,300 | $113,400 | $242,900 |
| 2022 | $4,449 | $318,500 | $103,200 | $215,300 |
| 2021 | $4,038 | $278,500 | $97,000 | $181,500 |
| 2020 | $4,062 | $268,100 | $92,900 | $175,200 |
| 2019 | $4,183 | $269,200 | $87,100 | $182,100 |
| 2018 | $3,768 | $234,600 | $87,100 | $147,500 |
| 2017 | $3,347 | $207,900 | $87,100 | $120,800 |
| 2016 | $3,430 | $197,600 | $83,200 | $114,400 |
| 2015 | $3,122 | $172,000 | $83,200 | $88,800 |
| 2014 | $2,866 | $158,100 | $83,200 | $74,900 |
Source: Public Records
Map
Nearby Homes