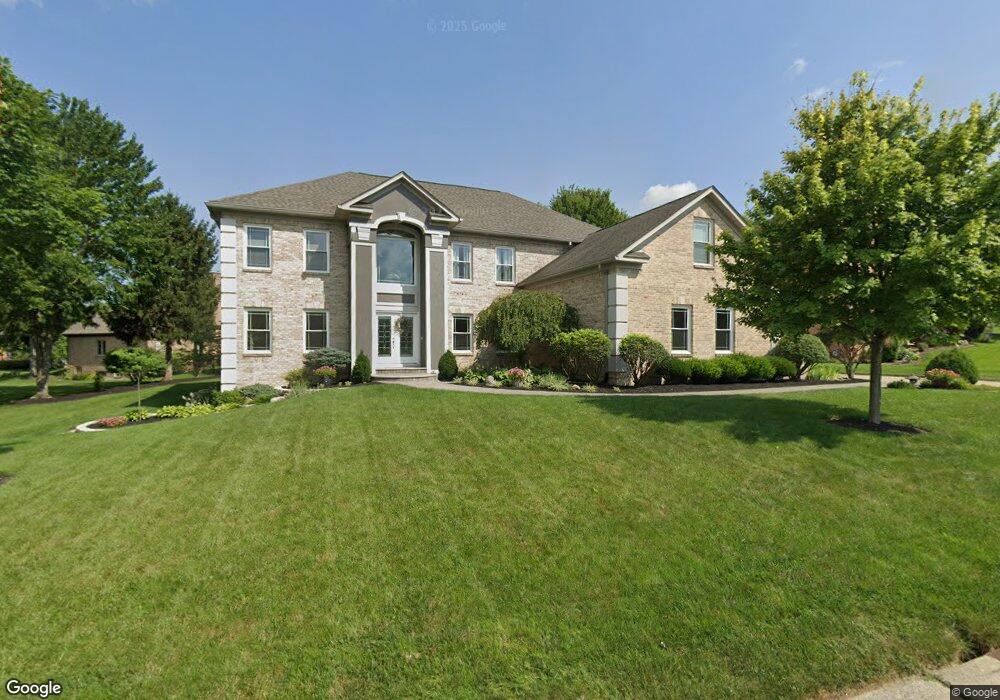
20 Carnoustie Ln Springboro, OH 45066
Estimated Value: $658,000 - $777,000
4
Beds
3
Baths
3,264
Sq Ft
$218/Sq Ft
Est. Value
About This Home
This home is located at 20 Carnoustie Ln, Springboro, OH 45066 and is currently estimated at $711,151, approximately $217 per square foot. 20 Carnoustie Ln is a home located in Warren County with nearby schools including Clearcreek Elementary School, Dennis Elementary School, and Springboro Intermediate School.
Ownership History
Date
Name
Owned For
Owner Type
Purchase Details
Closed on
Jul 27, 2000
Sold by
Russell Edward D
Bought by
Funk Craig C and Funk Stacy C
Current Estimated Value
Home Financials for this Owner
Home Financials are based on the most recent Mortgage that was taken out on this home.
Original Mortgage
$220,000
Outstanding Balance
$80,051
Interest Rate
8.27%
Mortgage Type
New Conventional
Estimated Equity
$631,100
Purchase Details
Closed on
Oct 28, 1998
Sold by
Sauley Timothy A
Bought by
Russell Edward D and Russell Lizette M
Home Financials for this Owner
Home Financials are based on the most recent Mortgage that was taken out on this home.
Original Mortgage
$227,150
Interest Rate
6.78%
Mortgage Type
Balloon
Purchase Details
Closed on
May 14, 1996
Sold by
K & W Dev Inc
Bought by
Sauley Timothy A and Sauley Kathy L
Home Financials for this Owner
Home Financials are based on the most recent Mortgage that was taken out on this home.
Original Mortgage
$200,000
Interest Rate
7.78%
Mortgage Type
New Conventional
Create a Home Valuation Report for This Property
The Home Valuation Report is an in-depth analysis detailing your home's value as well as a comparison with similar homes in the area
Home Values in the Area
Average Home Value in this Area
Purchase History
| Date | Buyer | Sale Price | Title Company |
|---|---|---|---|
| Funk Craig C | $365,000 | -- | |
| Russell Edward D | $345,000 | -- | |
| Sauley Timothy A | $49,000 | -- |
Source: Public Records
Mortgage History
| Date | Status | Borrower | Loan Amount |
|---|---|---|---|
| Open | Funk Craig C | $220,000 | |
| Previous Owner | Russell Edward D | $227,150 | |
| Previous Owner | Sauley Timothy A | $200,000 |
Source: Public Records
Tax History Compared to Growth
Tax History
| Year | Tax Paid | Tax Assessment Tax Assessment Total Assessment is a certain percentage of the fair market value that is determined by local assessors to be the total taxable value of land and additions on the property. | Land | Improvement |
|---|---|---|---|---|
| 2024 | $8,174 | $192,500 | $41,650 | $150,850 |
| 2023 | $7,154 | $152,596 | $24,573 | $128,023 |
| 2022 | $6,911 | $152,597 | $24,574 | $128,023 |
| 2021 | $6,467 | $152,597 | $24,574 | $128,023 |
| 2020 | $6,285 | $129,318 | $20,825 | $108,493 |
| 2019 | $5,835 | $129,318 | $20,825 | $108,493 |
| 2018 | $5,329 | $129,318 | $20,825 | $108,493 |
| 2017 | $5,699 | $115,497 | $17,409 | $98,088 |
| 2016 | $5,926 | $115,497 | $17,409 | $98,088 |
| 2015 | $5,523 | $115,497 | $17,409 | $98,088 |
| 2014 | $5,300 | $105,000 | $15,830 | $89,170 |
| 2013 | $5,296 | $138,160 | $20,830 | $117,330 |
Source: Public Records
Map
Nearby Homes
- 6265 Red Lion 5 Points Rd
- 595 Heatherwoode Cir
- 44 Dunnington Ct
- Hampton Plan at Northampton
- 55 Glasgow St Unit 37
- 65 Morris St Unit 17
- 130 Morris St Unit 8
- 70 Morris St Unit 6
- 65 Morris St
- 70 Morris St
- Cooke Plan at Northampton
- Barrett Plan at Northampton
- 45 Morris St
- 25 Morris St
- 30 Morris St
- 50 Morris St
- 35 Morris St
- Melville Plan at Northampton
- Clayton Plan at Northampton
- Nicholas Plan at Northampton
- 30 Carnoustie Ln
- 10 Carnoustie Ln
- 780 Heatherwoode Cir
- 25 Carnoustie Ln
- 40 Carnoustie Ln
- 770 Heatherwoode Cir
- 47 Carnoustie Ln
- 810 Heatherwoode Cir
- 795 Heatherwoode Cir
- 55 Carnoustie Ln
- 50 Carnoustie Ln
- 775 Heatherwoode Cir
- 910 Heatherwoode Cir
- 825 Heatherwoode Cir
- 760 Heatherwoode Cir
- 805 Heatherwoode Cir
- 63 Carnoustie Ln
- 920 Heatherwoode Cir
- 835 Heatherwoode Cir
- 60 Carnoustie Ln