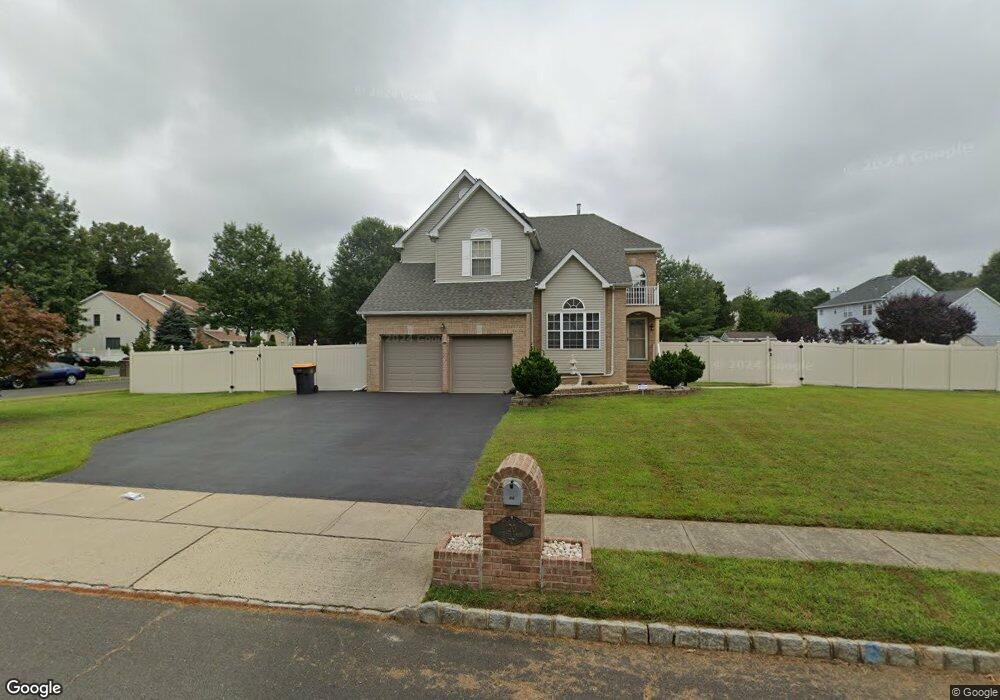
20 Carter Dr Old Bridge, NJ 08857
Estimated Value: $825,000 - $1,001,000
--
Bed
--
Bath
2,592
Sq Ft
$353/Sq Ft
Est. Value
About This Home
This home is located at 20 Carter Dr, Old Bridge, NJ 08857 and is currently estimated at $913,701, approximately $352 per square foot. 20 Carter Dr is a home located in Middlesex County with nearby schools including Old Bridge High School, Heroes Academy, and Immaculate Conception School.
Ownership History
Date
Name
Owned For
Owner Type
Purchase Details
Closed on
Sep 9, 2017
Sold by
Critell Glenn E and Critell Carmen
Bought by
Modi Veer and Shah Rishita
Current Estimated Value
Home Financials for this Owner
Home Financials are based on the most recent Mortgage that was taken out on this home.
Original Mortgage
$470,250
Outstanding Balance
$392,269
Interest Rate
3.86%
Mortgage Type
New Conventional
Estimated Equity
$521,432
Purchase Details
Closed on
Jun 16, 2000
Sold by
Hills Matchaponix
Bought by
Critelli Glenn and Critelli Carmen
Home Financials for this Owner
Home Financials are based on the most recent Mortgage that was taken out on this home.
Original Mortgage
$150,000
Interest Rate
8.59%
Create a Home Valuation Report for This Property
The Home Valuation Report is an in-depth analysis detailing your home's value as well as a comparison with similar homes in the area
Home Values in the Area
Average Home Value in this Area
Purchase History
| Date | Buyer | Sale Price | Title Company |
|---|---|---|---|
| Modi Veer | $522,500 | None Available | |
| Critelli Glenn | $285,395 | -- | |
| -- | $285,400 | -- |
Source: Public Records
Mortgage History
| Date | Status | Borrower | Loan Amount |
|---|---|---|---|
| Open | Modi Veer | $470,250 | |
| Previous Owner | -- | $150,000 |
Source: Public Records
Tax History Compared to Growth
Tax History
| Year | Tax Paid | Tax Assessment Tax Assessment Total Assessment is a certain percentage of the fair market value that is determined by local assessors to be the total taxable value of land and additions on the property. | Land | Improvement |
|---|---|---|---|---|
| 2025 | $14,366 | $254,400 | $73,700 | $180,700 |
| 2024 | $13,781 | $254,400 | $73,700 | $180,700 |
| 2023 | $13,781 | $254,400 | $73,700 | $180,700 |
| 2022 | $13,465 | $254,400 | $73,700 | $180,700 |
| 2021 | $13,064 | $254,400 | $73,700 | $180,700 |
| 2020 | $13,069 | $254,400 | $73,700 | $180,700 |
| 2019 | $12,847 | $254,400 | $73,700 | $180,700 |
| 2018 | $12,705 | $254,400 | $73,700 | $180,700 |
| 2017 | $12,351 | $255,600 | $73,700 | $181,900 |
| 2016 | $12,095 | $255,600 | $73,700 | $181,900 |
| 2015 | $11,885 | $255,600 | $73,700 | $181,900 |
| 2014 | $11,765 | $255,600 | $73,700 | $181,900 |
Source: Public Records
Map
Nearby Homes