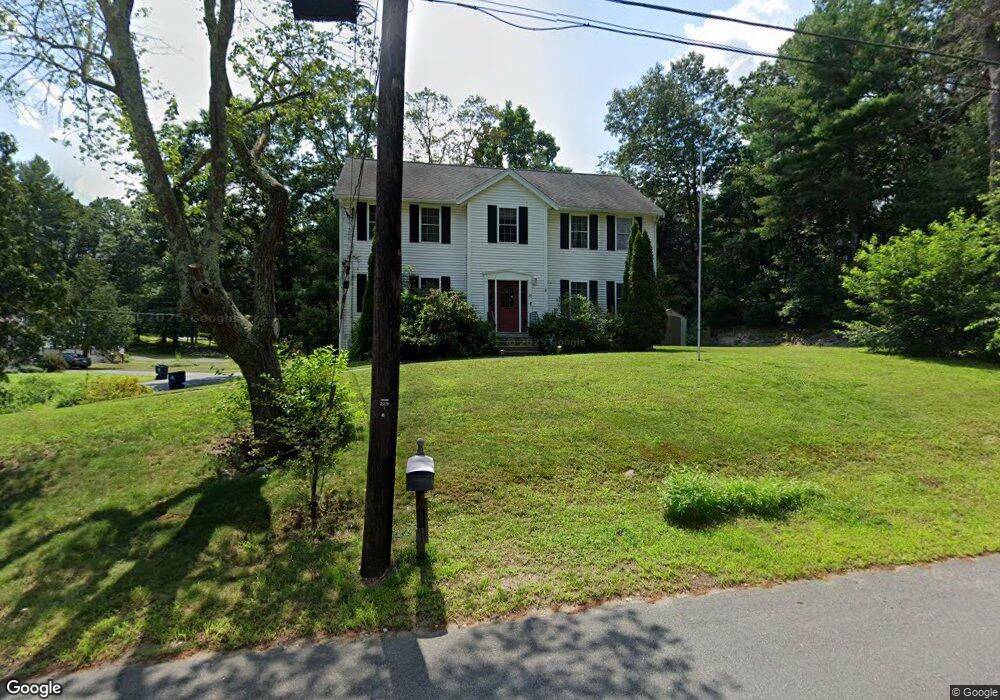
20 Cedar St Wilmington, MA 01887
Estimated Value: $907,310 - $962,000
4
Beds
3
Baths
2,392
Sq Ft
$387/Sq Ft
Est. Value
About This Home
This home is located at 20 Cedar St, Wilmington, MA 01887 and is currently estimated at $925,328, approximately $386 per square foot. 20 Cedar St is a home located in Middlesex County with nearby schools including Wilmington Middle School, Wilmington High School, and Abundant Life Christian School and Childcare.
Ownership History
Date
Name
Owned For
Owner Type
Purchase Details
Closed on
Aug 30, 2010
Sold by
Stewart George M and Stewart Jennifer A
Bought by
Xing Xuechao
Current Estimated Value
Home Financials for this Owner
Home Financials are based on the most recent Mortgage that was taken out on this home.
Original Mortgage
$412,275
Interest Rate
4.57%
Mortgage Type
Purchase Money Mortgage
Purchase Details
Closed on
Aug 15, 2005
Sold by
Ward Karen M
Bought by
Stewart George M
Home Financials for this Owner
Home Financials are based on the most recent Mortgage that was taken out on this home.
Original Mortgage
$424,000
Interest Rate
5.54%
Mortgage Type
Purchase Money Mortgage
Purchase Details
Closed on
Oct 5, 2001
Sold by
Williamsville Llc
Bought by
Ward Karen M
Purchase Details
Closed on
Feb 7, 2001
Sold by
Oreilly John C and Herbel Beverly
Bought by
Williamsville Llc
Create a Home Valuation Report for This Property
The Home Valuation Report is an in-depth analysis detailing your home's value as well as a comparison with similar homes in the area
Purchase History
| Date | Buyer | Sale Price | Title Company |
|---|---|---|---|
| Xing Xuechao | $461,500 | -- | |
| Stewart George M | $530,000 | -- | |
| Ward Karen M | $439,900 | -- | |
| Williamsville Llc | $150,000 | -- |
Source: Public Records
Mortgage History
| Date | Status | Borrower | Loan Amount |
|---|---|---|---|
| Open | Williamsville Llc | $364,500 | |
| Closed | Xing Xuechao | $412,275 | |
| Previous Owner | Stewart George M | $424,000 |
Source: Public Records
Tax History
| Year | Tax Paid | Tax Assessment Tax Assessment Total Assessment is a certain percentage of the fair market value that is determined by local assessors to be the total taxable value of land and additions on the property. | Land | Improvement |
|---|---|---|---|---|
| 2025 | $9,252 | $808,000 | $274,900 | $533,100 |
| 2024 | $9,051 | $791,900 | $274,900 | $517,000 |
| 2023 | $8,442 | $707,000 | $249,900 | $457,100 |
| 2022 | $7,980 | $612,400 | $208,200 | $404,200 |
| 2021 | $8,045 | $581,300 | $189,200 | $392,100 |
| 2020 | $7,783 | $573,100 | $189,200 | $383,900 |
| 2019 | $7,607 | $553,200 | $180,200 | $373,000 |
| 2018 | $7,466 | $518,100 | $171,700 | $346,400 |
| 2017 | $7,433 | $514,400 | $167,100 | $347,300 |
| 2016 | $6,971 | $476,500 | $159,200 | $317,300 |
| 2015 | $6,748 | $469,600 | $159,200 | $310,400 |
| 2014 | $6,323 | $444,000 | $151,600 | $292,400 |
Source: Public Records
Map
Nearby Homes
- 31 Burlington Ave
- 3 Clark Terrace
- 6 Patricia Cir
- 224 Burlington Ave
- 9 Parker St
- 7 Cross St Unit 303
- 7 Cross St Unit 304
- 7 Cross St Unit 205
- 7 Cross St Unit 102
- 255 Burlington Ave
- 3 Molloy Rd
- 56 Grove Ave
- 584 Woburn St
- 12 Hamlin Ln
- 203 Lowell St Unit 316
- 203 Lowell St Unit 218
- 203 Lowell St Unit 120
- 15 Mystic Ave
- 29 Beaverbrook Rd
- 44 Connolly Rd
Your Personal Tour Guide
Ask me questions while you tour the home.