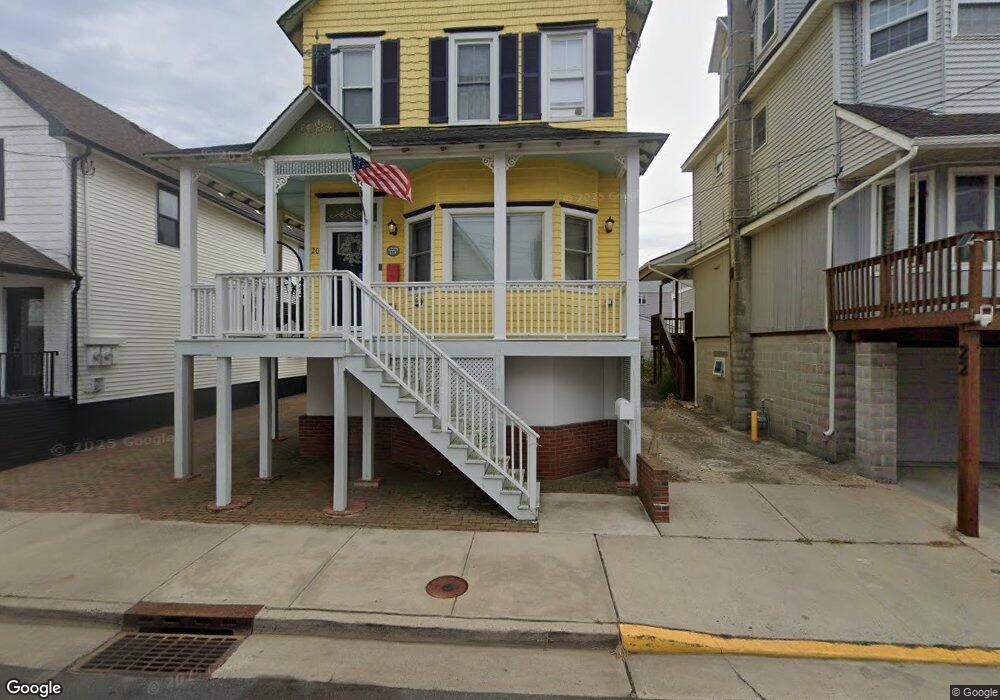
20 Center St Unit SPRING 2024 Sea Bright, NJ 07760
Sea Bright NeighborhoodEstimated Value: $1,261,000 - $1,482,480
3
Beds
3
Baths
1,689
Sq Ft
$801/Sq Ft
Est. Value
About This Home
This home is located at 20 Center St Unit SPRING 2024, Sea Bright, NJ 07760 and is currently estimated at $1,352,620, approximately $800 per square foot. 20 Center St Unit SPRING 2024 is a home located in Monmouth County with nearby schools including Wolf Hill Elementary School, Maple Place Elementary and Middle School, and Shore Regional High School.
Ownership History
Date
Name
Owned For
Owner Type
Purchase Details
Closed on
Sep 21, 2020
Sold by
Sinnott Jeffrey and Sinnott Cristine M
Bought by
Rivarola Brenda and Rivarola Mariano
Current Estimated Value
Home Financials for this Owner
Home Financials are based on the most recent Mortgage that was taken out on this home.
Original Mortgage
$607,000
Outstanding Balance
$538,672
Interest Rate
2.9%
Mortgage Type
New Conventional
Estimated Equity
$813,948
Purchase Details
Closed on
Sep 13, 2004
Sold by
Rappoport Diane
Bought by
Sinnott Jeffrey
Home Financials for this Owner
Home Financials are based on the most recent Mortgage that was taken out on this home.
Original Mortgage
$440,000
Interest Rate
5.84%
Purchase Details
Closed on
Jul 26, 2002
Sold by
Parigian Thomas
Bought by
Rappoport Diane and Walzog Nancy
Create a Home Valuation Report for This Property
The Home Valuation Report is an in-depth analysis detailing your home's value as well as a comparison with similar homes in the area
Home Values in the Area
Average Home Value in this Area
Purchase History
| Date | Buyer | Sale Price | Title Company |
|---|---|---|---|
| Rivarola Brenda | $832,000 | All Ahead Title Agency | |
| Sinnott Jeffrey | $550,000 | -- | |
| Rappoport Diane | $229,900 | -- |
Source: Public Records
Mortgage History
| Date | Status | Borrower | Loan Amount |
|---|---|---|---|
| Open | Rivarola Brenda | $607,000 | |
| Previous Owner | Sinnott Jeffrey | $440,000 |
Source: Public Records
Tax History Compared to Growth
Tax History
| Year | Tax Paid | Tax Assessment Tax Assessment Total Assessment is a certain percentage of the fair market value that is determined by local assessors to be the total taxable value of land and additions on the property. | Land | Improvement |
|---|---|---|---|---|
| 2025 | $10,026 | $1,208,700 | $768,100 | $440,600 |
| 2024 | $8,898 | $1,048,700 | $658,100 | $390,600 |
| 2023 | $8,898 | $868,900 | $533,100 | $335,800 |
| 2022 | $6,976 | $796,200 | $473,100 | $323,100 |
| 2021 | $6,976 | $560,300 | $381,000 | $179,300 |
| 2020 | $6,619 | $515,500 | $341,000 | $174,500 |
| 2019 | $5,748 | $423,600 | $248,800 | $174,800 |
| 2018 | $4,763 | $331,700 | $152,200 | $179,500 |
| 2017 | $4,355 | $298,500 | $122,200 | $176,300 |
| 2016 | $2,994 | $229,400 | $112,200 | $117,200 |
| 2015 | $4,756 | $237,100 | $92,200 | $144,900 |
| 2014 | $4,577 | $229,200 | $122,200 | $107,000 |
Source: Public Records
Map
Nearby Homes
- 26 Center St
- 24 Surf St
- 1184 Ocean Ave Unit A3
- 10 South St
- 11 South St
- 1080 Ocean Ave Unit 402
- 24 Grant Ave
- 2 Tradewinds Ln
- 24 Warren St
- 1332 Ocean Ave Unit 5
- 1340 Ocean Ave Unit 27
- 1382 Ocean Ave Unit 17A
- 10 Imbrie Place
- 5 Island View Way Unit 3
- 1492 Ocean Ave Unit A3
- 1500 Ocean Ave
- 1566 Ocean Ave Unit 38
- 129 Avenue of Two Rivers
- 14 Ridge Rd
- 93 Rumson Rd
- 20 Center St
- 20 Center St Unit Sept 2024
- 20 Center St Unit May 2024
- 20 Center St Unit JUNE 2024 ONLY
- 20 Center St Unit JUNE 2023 ONLY
- 20 Center St Unit SEPT 2023 ONLY
- 20 Center St Unit AUGUST 2023 ONLY
- 20 Center St Unit SPRING 2023
- 20 Center St Unit WINTER 2022
- 20 Center St Unit JUNE ONLY
- 20 Center St Unit SEPTEMBER ONLY
- 20 Center St Unit JUNE
- 18 Center St
- 18 Center St
- 24 Center St Unit 1
- 24 Center St
- 24 Center St
- 15 Osborne Place
- 14 Center St
- 14 Center St Unit AUG