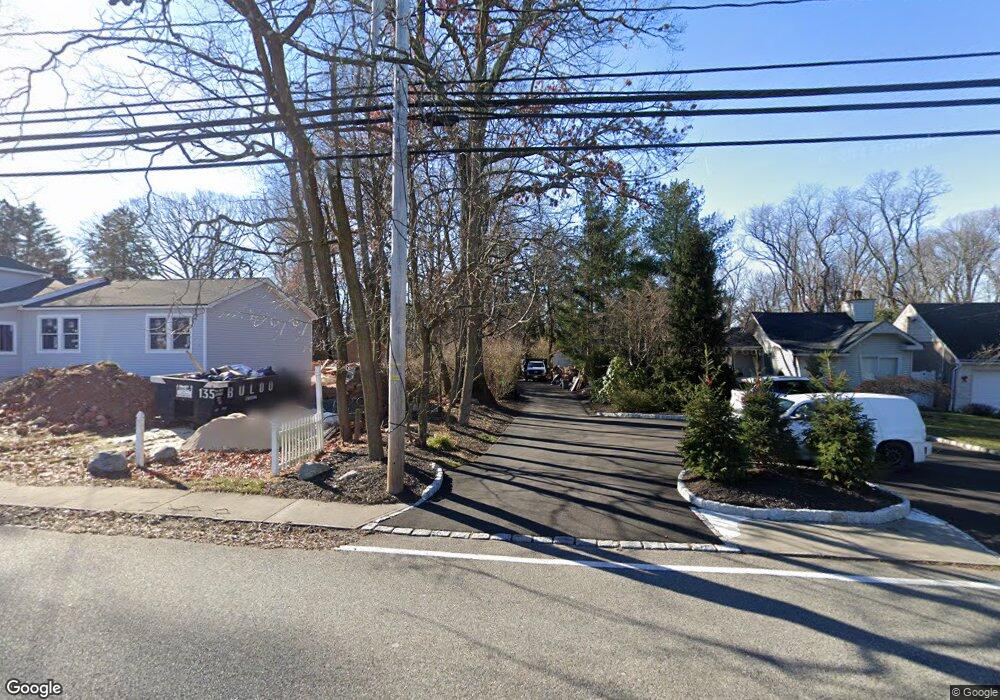
20 Central Ave Old Tappan, NJ 07675
Estimated Value: $382,896 - $1,032,000
Studio
--
Bath
--
Sq Ft
10,629
Sq Ft Lot
About This Home
This home is located at 20 Central Ave, Old Tappan, NJ 07675 and is currently estimated at $725,974. 20 Central Ave is a home located in Bergen County with nearby schools including T. Baldwin Demarest Elementary School, Charles DeWolf Middle School, and Northern Valley Regional High School at Old Tappan.
Ownership History
Date
Name
Owned For
Owner Type
Purchase Details
Closed on
Oct 27, 2023
Sold by
Velsen Mortgage Corp
Bought by
Tony Lomardo Construction and Professional Fix-It Service Llc
Current Estimated Value
Purchase Details
Closed on
Sep 17, 2002
Sold by
Pope Marc
Bought by
Farmer Ligregni Inc
Purchase Details
Closed on
May 22, 1998
Sold by
Cybt Llc
Bought by
Multicultural Radio Broadcasting Inc
Purchase Details
Closed on
Dec 17, 1997
Sold by
C & W Land Corp
Bought by
Cybt Llc
Create a Home Valuation Report for This Property
The Home Valuation Report is an in-depth analysis detailing your home's value as well as a comparison with similar homes in the area
Home Values in the Area
Average Home Value in this Area
Purchase History
| Date | Buyer | Sale Price | Title Company |
|---|---|---|---|
| Tony Lomardo Construction | $40,000 | Fidelity National Title | |
| Tony Lomardo Construction | $40,000 | Fidelity National Title | |
| Farmer Ligregni Inc | $85,000 | -- | |
| -- | -- | -- | |
| Multicultural Radio Broadcasting Inc | $1,200,000 | -- | |
| Cybt Llc | $1,600,000 | -- |
Source: Public Records
Tax History
| Year | Tax Paid | Tax Assessment Tax Assessment Total Assessment is a certain percentage of the fair market value that is determined by local assessors to be the total taxable value of land and additions on the property. | Land | Improvement |
|---|---|---|---|---|
| 2025 | $1,297 | $58,900 | $37,400 | $21,500 |
| 2024 | $1,269 | $58,900 | $37,400 | $21,500 |
| 2023 | $1,253 | $58,900 | $37,400 | $21,500 |
| 2022 | $1,253 | $58,900 | $37,400 | $21,500 |
| 2021 | $1,250 | $58,900 | $37,400 | $21,500 |
| 2020 | $1,232 | $58,900 | $37,400 | $21,500 |
| 2019 | $1,215 | $58,900 | $37,400 | $21,500 |
| 2018 | $1,190 | $58,900 | $37,400 | $21,500 |
| 2017 | $1,181 | $58,900 | $37,400 | $21,500 |
| 2016 | $1,150 | $58,900 | $37,400 | $21,500 |
| 2015 | $1,132 | $58,900 | $37,400 | $21,500 |
| 2014 | $1,102 | $58,900 | $37,400 | $21,500 |
Source: Public Records
Map
Nearby Homes
- 40 Orangeburgh Rd
- 215 White Ave
- 192 White Ave
- 26 Carter St
- 59 Lohs Place
- 112 Winding Creek
- 401 Dercole Ct Unit 332
- 37 Blanch Ave
- 12 Meadow Ct
- 26 Garnett Place
- 323 Rivervale Ave
- 5 Kenyon Ct
- 31 Virgil Rd
- 291 Tappan Rd
- 49 Carpenter Ave
- 410 Tappan Rd
- 272 Rockland Ave
- 32 Moeser Place
- 231 Hudson Ave
- 54 Charles Place
Your Personal Tour Guide
Ask me questions while you tour the home.