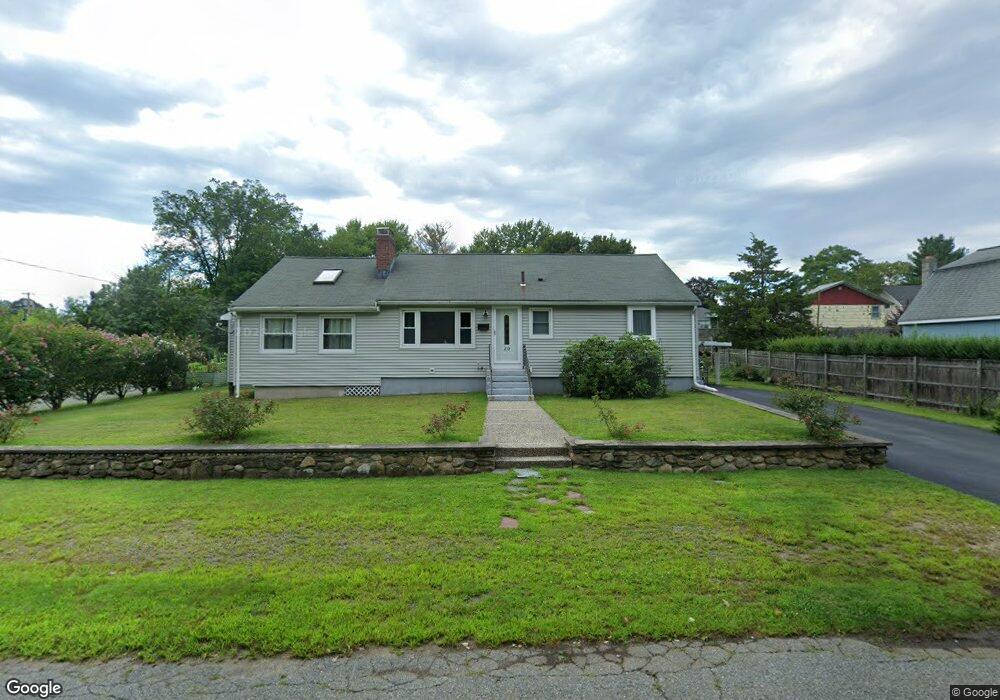
20 Central St Bellingham, MA 02019
Estimated Value: $507,175 - $578,000
3
Beds
1
Bath
2,524
Sq Ft
$212/Sq Ft
Est. Value
About This Home
This home is located at 20 Central St, Bellingham, MA 02019 and is currently estimated at $534,544, approximately $211 per square foot. 20 Central St is a home located in Norfolk County with nearby schools including Joseph F. DiPietro Elementary, Bellingham High School, and Rise Prep Mayoral Academy Middle School.
Ownership History
Date
Name
Owned For
Owner Type
Purchase Details
Closed on
Sep 27, 2024
Sold by
Berchtold Peter W and Berchtold Melanie A
Bought by
Berchtod Ft and Berchtold
Current Estimated Value
Purchase Details
Closed on
Oct 11, 2002
Sold by
Bergen Ruth H Est and Benjamin Franklin Sb
Bought by
Berchtold Melanie and Berchtold Peter W
Home Financials for this Owner
Home Financials are based on the most recent Mortgage that was taken out on this home.
Original Mortgage
$116,400
Interest Rate
6.24%
Mortgage Type
Purchase Money Mortgage
Create a Home Valuation Report for This Property
The Home Valuation Report is an in-depth analysis detailing your home's value as well as a comparison with similar homes in the area
Home Values in the Area
Average Home Value in this Area
Purchase History
| Date | Buyer | Sale Price | Title Company |
|---|---|---|---|
| Berchtod Ft | -- | None Available | |
| Berchtod Ft | -- | None Available | |
| Berchtold Melanie | $145,500 | -- | |
| Berchtold Melanie | $145,500 | -- |
Source: Public Records
Mortgage History
| Date | Status | Borrower | Loan Amount |
|---|---|---|---|
| Previous Owner | Berchtold Melanie | $169,000 | |
| Previous Owner | Berchtold Melanie | $116,400 |
Source: Public Records
Tax History
| Year | Tax Paid | Tax Assessment Tax Assessment Total Assessment is a certain percentage of the fair market value that is determined by local assessors to be the total taxable value of land and additions on the property. | Land | Improvement |
|---|---|---|---|---|
| 2025 | $4,973 | $395,900 | $124,700 | $271,200 |
| 2024 | $4,406 | $342,600 | $113,800 | $228,800 |
| 2023 | $4,245 | $325,300 | $108,400 | $216,900 |
| 2022 | $4,166 | $295,900 | $90,400 | $205,500 |
| 2021 | $4,007 | $278,100 | $90,400 | $187,700 |
| 2020 | $3,771 | $265,200 | $90,400 | $174,800 |
| 2019 | $3,675 | $258,600 | $90,400 | $168,200 |
| 2018 | $3,422 | $237,500 | $87,900 | $149,600 |
| 2017 | $3,320 | $231,500 | $87,900 | $143,600 |
| 2016 | $3,102 | $217,100 | $90,200 | $126,900 |
| 2015 | $2,997 | $210,300 | $87,500 | $122,800 |
| 2014 | $3,193 | $217,800 | $92,100 | $125,700 |
Source: Public Records
Map
Nearby Homes
- 194 Paine St
- 101 Pine Grove Ave
- Lot 2 Pulaski Blvd
- 33 Achille St
- 70 Oswego St
- 202 Paine St
- 188 Saint Louis Ave
- 79 Saint Agnes Ave
- 89 Saint Agnes Ave
- 1088 Diamond Hill Rd
- 212 Saint Louis Ave
- 7 Theresa Marie Ave
- 213 St Louis Ave
- 1175 Diamond Hill Rd Unit 305
- 77 Theresa Marie Ave
- 124 Saint Leon Ave
- 13 Ethel St
- 108 Mill St Unit 104
- 551 Wood Ave
- 92 Mill St Unit 303
Your Personal Tour Guide
Ask me questions while you tour the home.