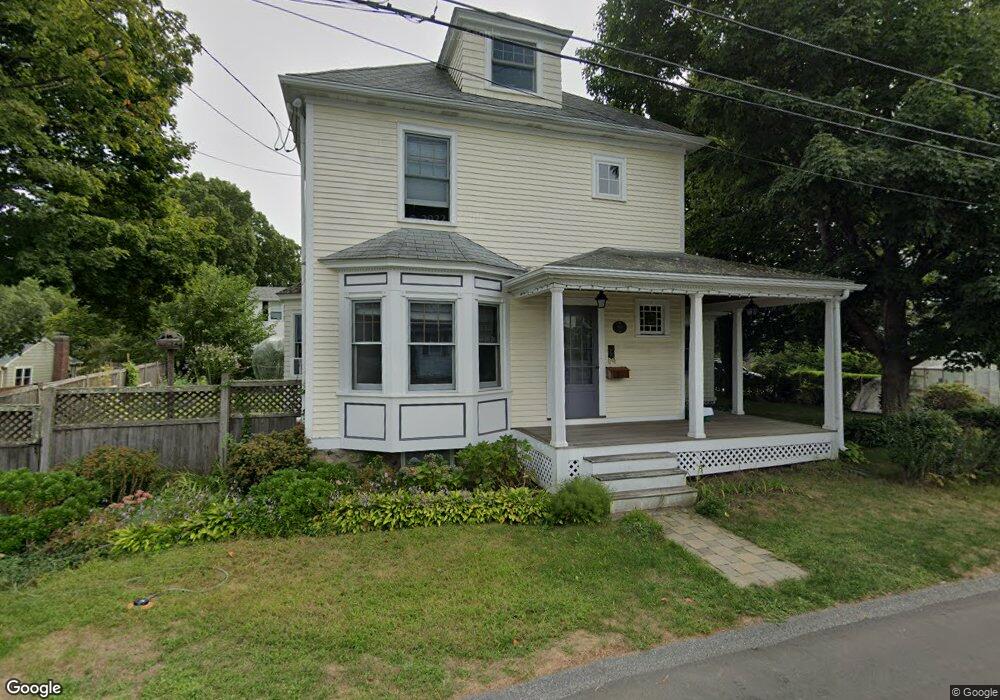
20 Chase Ave Lexington, MA 02421
East Lexington NeighborhoodEstimated Value: $1,167,000 - $1,271,000
3
Beds
3
Baths
1,856
Sq Ft
$656/Sq Ft
Est. Value
About This Home
This home is located at 20 Chase Ave, Lexington, MA 02421 and is currently estimated at $1,216,899, approximately $655 per square foot. 20 Chase Ave is a home located in Middlesex County with nearby schools including Bowman Elementary School, Jonas Clarke Middle School, and Lexington High School.
Ownership History
Date
Name
Owned For
Owner Type
Purchase Details
Closed on
May 6, 2002
Sold by
Batchelder Tracy D and Batchelder Penny A
Bought by
Noel Michael S and Noel Jennifer
Current Estimated Value
Home Financials for this Owner
Home Financials are based on the most recent Mortgage that was taken out on this home.
Original Mortgage
$264,800
Interest Rate
7.13%
Mortgage Type
Purchase Money Mortgage
Purchase Details
Closed on
May 21, 1992
Sold by
Field Ilda J
Bought by
Monzillo Ronald M and Ladd Carol M
Create a Home Valuation Report for This Property
The Home Valuation Report is an in-depth analysis detailing your home's value as well as a comparison with similar homes in the area
Home Values in the Area
Average Home Value in this Area
Purchase History
| Date | Buyer | Sale Price | Title Company |
|---|---|---|---|
| Noel Michael S | $269,000 | -- | |
| Monzillo Ronald M | $184,600 | -- |
Source: Public Records
Mortgage History
| Date | Status | Borrower | Loan Amount |
|---|---|---|---|
| Open | Monzillo Ronald M | $281,000 | |
| Closed | Noel Michael S | $264,800 | |
| Previous Owner | Monzillo Ronald M | $50,000 | |
| Closed | Monzillo Ronald M | $0 |
Source: Public Records
Tax History Compared to Growth
Tax History
| Year | Tax Paid | Tax Assessment Tax Assessment Total Assessment is a certain percentage of the fair market value that is determined by local assessors to be the total taxable value of land and additions on the property. | Land | Improvement |
|---|---|---|---|---|
| 2025 | $12,634 | $1,033,000 | $642,000 | $391,000 |
| 2024 | $11,895 | $971,000 | $612,000 | $359,000 |
| 2023 | $11,596 | $892,000 | $556,000 | $336,000 |
| 2022 | $11,150 | $808,000 | $505,000 | $303,000 |
| 2021 | $11,066 | $769,000 | $481,000 | $288,000 |
| 2020 | $10,692 | $761,000 | $481,000 | $280,000 |
| 2019 | $10,265 | $727,000 | $458,000 | $269,000 |
| 2018 | $239 | $727,000 | $436,000 | $291,000 |
| 2017 | $9,013 | $622,000 | $403,000 | $219,000 |
| 2016 | $8,716 | $597,000 | $383,000 | $214,000 |
| 2015 | $8,336 | $561,000 | $349,000 | $212,000 |
| 2014 | $7,864 | $507,000 | $310,000 | $197,000 |
Source: Public Records
Map
Nearby Homes
- 4 Aerial St
- 107 Hibbert St
- 64 Browning Rd
- 475 Massachusetts Ave Unit B
- 6 Linc Cole Ln
- 56 Valentine Rd
- 10 Colonial Village Dr Unit 2
- 70 Birch Hill Rd
- 181 Lowell St
- 58 Westminster Ave Unit 58
- 35 Tower Rd
- 36 Independence Ave
- 14 Park Avenue Extension
- 25 Maple St
- 51 Lowell St
- 1 Watermill Place Unit 309
- 1 Watermill Place Unit 308
- 53 Crestview Rd
- 11 Lowell St Unit B
- 0 Reed St