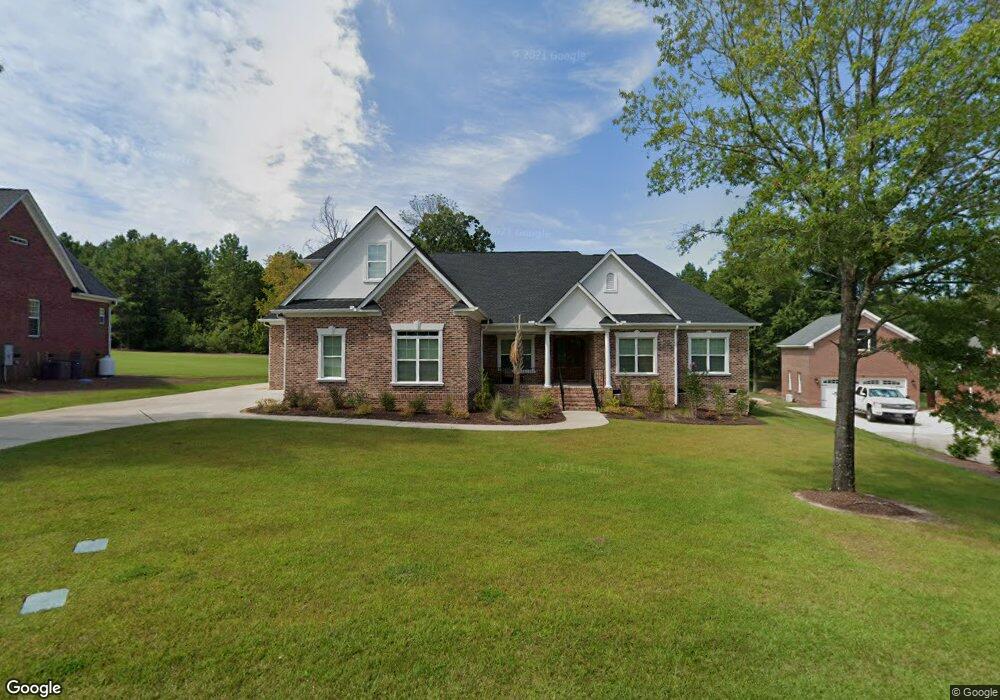
20 Clay Ct Chapin, SC 29036
Estimated Value: $600,000 - $743,000
3
Beds
4
Baths
3,350
Sq Ft
$202/Sq Ft
Est. Value
About This Home
This home is located at 20 Clay Ct, Chapin, SC 29036 and is currently estimated at $676,653, approximately $201 per square foot. 20 Clay Ct is a home located in Lexington County with nearby schools including Lake Murray Elementary School, Chapin Intermediate, and Chapin High School.
Ownership History
Date
Name
Owned For
Owner Type
Purchase Details
Closed on
May 19, 2020
Sold by
Cash Iii Ralph J and Cash Kristina T
Bought by
Cash Kristina T
Current Estimated Value
Purchase Details
Closed on
Jan 13, 2017
Sold by
Splittgerber Albert F and Splittgerber Deidre
Bought by
Cash Ralph J and Cash Kristina T
Purchase Details
Closed on
Jun 18, 2013
Sold by
Johnston Barry and Johnston Michelle
Bought by
Splittgerber Albert F and Splittgerber Deidre
Home Financials for this Owner
Home Financials are based on the most recent Mortgage that was taken out on this home.
Original Mortgage
$53,530
Interest Rate
3.59%
Mortgage Type
Future Advance Clause Open End Mortgage
Purchase Details
Closed on
Apr 6, 2005
Sold by
S W B Inc
Bought by
Johnston Barry and Johnston Michelle
Create a Home Valuation Report for This Property
The Home Valuation Report is an in-depth analysis detailing your home's value as well as a comparison with similar homes in the area
Home Values in the Area
Average Home Value in this Area
Purchase History
| Date | Buyer | Sale Price | Title Company |
|---|---|---|---|
| Cash Kristina T | -- | None Available | |
| Cash Ralph J | $56,000 | None Available | |
| Cash Ralph J | $56,000 | None Available | |
| Splittgerber Albert F | $59,500 | -- | |
| Johnston Barry | $52,000 | -- |
Source: Public Records
Mortgage History
| Date | Status | Borrower | Loan Amount |
|---|---|---|---|
| Previous Owner | Splittgerber Albert F | $53,530 |
Source: Public Records
Tax History Compared to Growth
Tax History
| Year | Tax Paid | Tax Assessment Tax Assessment Total Assessment is a certain percentage of the fair market value that is determined by local assessors to be the total taxable value of land and additions on the property. | Land | Improvement |
|---|---|---|---|---|
| 2024 | $2,836 | $17,220 | $2,200 | $15,020 |
| 2023 | $2,635 | $16,924 | $2,162 | $14,762 |
| 2022 | $2,735 | $16,924 | $2,162 | $14,762 |
| 2020 | $2,735 | $16,924 | $2,162 | $14,762 |
| 2019 | $2,421 | $14,717 | $2,240 | $12,477 |
| 2018 | $9,121 | $14,717 | $2,240 | $12,477 |
| 2017 | $1,352 | $3,300 | $3,300 | $0 |
| 2016 | $1,342 | $3,300 | $3,300 | $0 |
| 2015 | $1,392 | $3,300 | $3,300 | $0 |
| 2014 | $1,392 | $3,570 | $3,570 | $0 |
| 2013 | -- | $2,420 | $2,420 | $0 |
Source: Public Records
Map
Nearby Homes
- 24 Clay Ct
- 306 Dolly Horn Ln
- 138 Sunsation Dr
- 304 Racket Rd
- 129 Forest Bickley Rd
- 110 Lake Hilton Dr
- 275 Hilton Village Dr
- 2515 Wessinger Rd
- 2207 Wessinger Rd
- 2544 Wessinger Rd
- 435 Whits End
- 551 Village Church Dr
- 308 Grannys Cut Way
- 630 Basalt Ct
- The Bancroft Plan at Chapin Place
- 311 Pebblebranch Dr
- Lot 4 Lake Breeze
- 740 Ruskin Dr
- 550 Malachite Ln
- 515 Malachite Ln