20 Clayton Burns Rd Dahlonega, GA 30533
Estimated Value: $256,000 - $352,000
3
Beds
1
Bath
1,548
Sq Ft
$189/Sq Ft
Est. Value
About This Home
This home is located at 20 Clayton Burns Rd, Dahlonega, GA 30533 and is currently estimated at $293,011, approximately $189 per square foot. 20 Clayton Burns Rd is a home located in Lumpkin County with nearby schools including Lumpkin County High School.
Ownership History
Date
Name
Owned For
Owner Type
Purchase Details
Closed on
Aug 24, 2011
Sold by
New York Community
Bought by
Chattin Johnny A
Current Estimated Value
Purchase Details
Closed on
May 3, 2011
Sold by
Connors Colleen
Bought by
New York Community
Purchase Details
Closed on
Apr 17, 2006
Sold by
Richards Michelle
Bought by
Connors Colleen
Home Financials for this Owner
Home Financials are based on the most recent Mortgage that was taken out on this home.
Original Mortgage
$62,227
Interest Rate
6.31%
Mortgage Type
New Conventional
Purchase Details
Closed on
Jan 9, 2004
Sold by
East Richard Wayne & Tammy
Bought by
Richards Michelle
Purchase Details
Closed on
Aug 15, 2001
Sold by
East Richard Wayne & Tammy
Bought by
East Richard Wayne & Tammy
Purchase Details
Closed on
Oct 6, 1995
Sold by
East Richard Wayne
Bought by
East Richard Wayne
Purchase Details
Closed on
Oct 5, 1995
Sold by
East Richard Wayne
Bought by
East Richard Wayne
Purchase Details
Closed on
Mar 4, 1994
Sold by
Crow J H
Bought by
East Richard Wayne
Create a Home Valuation Report for This Property
The Home Valuation Report is an in-depth analysis detailing your home's value as well as a comparison with similar homes in the area
Home Values in the Area
Average Home Value in this Area
Purchase History
| Date | Buyer | Sale Price | Title Company |
|---|---|---|---|
| Chattin Johnny A | $35,000 | -- | |
| New York Community | $70,000 | -- | |
| Connors Colleen | $112,000 | -- | |
| Richards Michelle | $105,000 | -- | |
| East Richard Wayne & Tammy | -- | -- | |
| East Richard Wayne | $46,000 | -- | |
| East Richard Wayne | -- | -- | |
| East Richard Wayne | -- | -- |
Source: Public Records
Mortgage History
| Date | Status | Borrower | Loan Amount |
|---|---|---|---|
| Previous Owner | Connors Colleen | $62,227 |
Source: Public Records
Tax History Compared to Growth
Tax History
| Year | Tax Paid | Tax Assessment Tax Assessment Total Assessment is a certain percentage of the fair market value that is determined by local assessors to be the total taxable value of land and additions on the property. | Land | Improvement |
|---|---|---|---|---|
| 2024 | $1,432 | $59,586 | $8,860 | $50,726 |
| 2023 | $1,303 | $55,385 | $8,280 | $47,105 |
| 2022 | $1,226 | $49,538 | $6,900 | $42,638 |
| 2021 | $1,087 | $42,446 | $6,900 | $35,546 |
| 2020 | $1,084 | $41,091 | $6,612 | $34,479 |
| 2019 | $1,094 | $41,091 | $6,612 | $34,479 |
| 2018 | $1,052 | $37,070 | $6,612 | $30,458 |
| 2017 | $1,057 | $36,552 | $6,612 | $29,940 |
| 2016 | $974 | $32,573 | $6,612 | $25,961 |
| 2015 | $878 | $32,573 | $6,612 | $25,961 |
| 2014 | $878 | $33,286 | $6,612 | $26,674 |
| 2013 | -- | $33,987 | $6,612 | $27,375 |
Source: Public Records
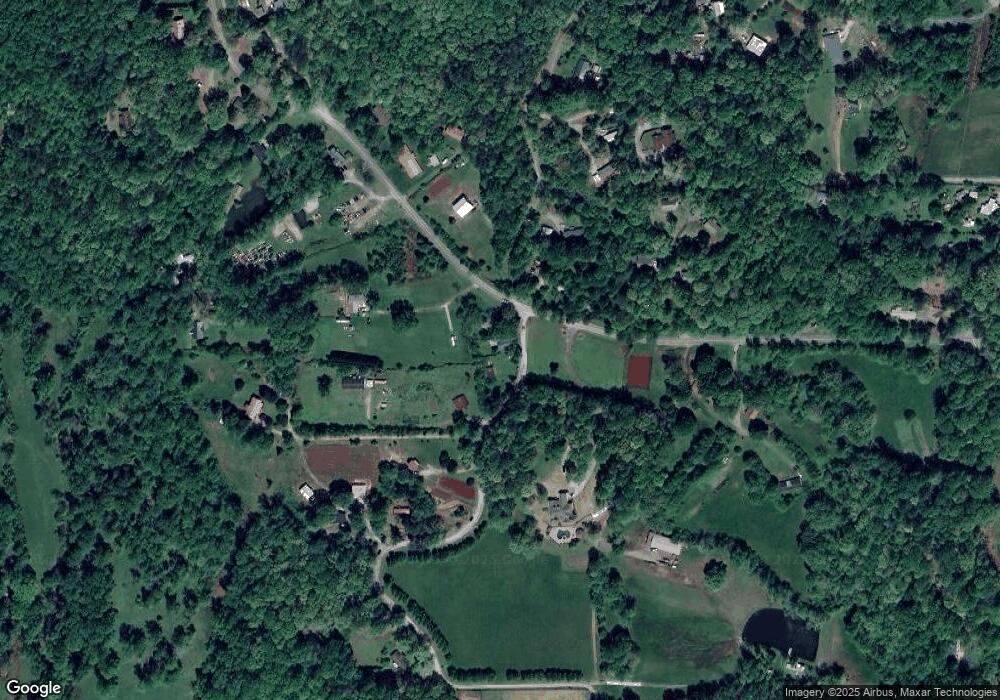
Map
Nearby Homes
- 0 Woodland Ln Unit 10570991
- 7B Strada Valdichiana
- 931 Homer Edwards Rd
- 120 Sanders Blvd
- 100 Sanders Blvd
- 64 Hickory Ln
- 1202 Oak Grove Rd
- 549 Ivy Terrace
- 132 J Mountain Dr
- 121 Blair Ridge Rd
- 5.31 Tom Bell Odom Rd
- 120 Blair Ridge Rd
- 20 Angels Way
- 543 Rider Mill Rd
- 253 Blair Ridge Rd
- 70 Avery Trail
- 81 Anderson Dr
- 436 Applewood Ln
- 262 Homer Edwards Rd
- 311 Homer Edwards Rd
- 35 Andys Cir
- 69 Luke and Tanners Ridge
- 38 Off of Homer Edwards Rd
- 251 Homer Edwards Rd
- 69 Luke Tanners Ridge
- 175 Homer Edwards Rd
- 68 Luke Tanners Ridge
- 68 Luke Tanners Ridge
- 79 Luke Tanners Ridge
- 380 Homer Edwards Rd
- 385 Homer Edwards Rd
- 200 Clayton Burns Rd
- 115 Fernwood Dr
- 82 Luke Tanners Ridge
- 145 Homer Edwards Rd
- 426 Homer Edwards Rd
- 200 Shorty Dr
- 200 Shorty Dr