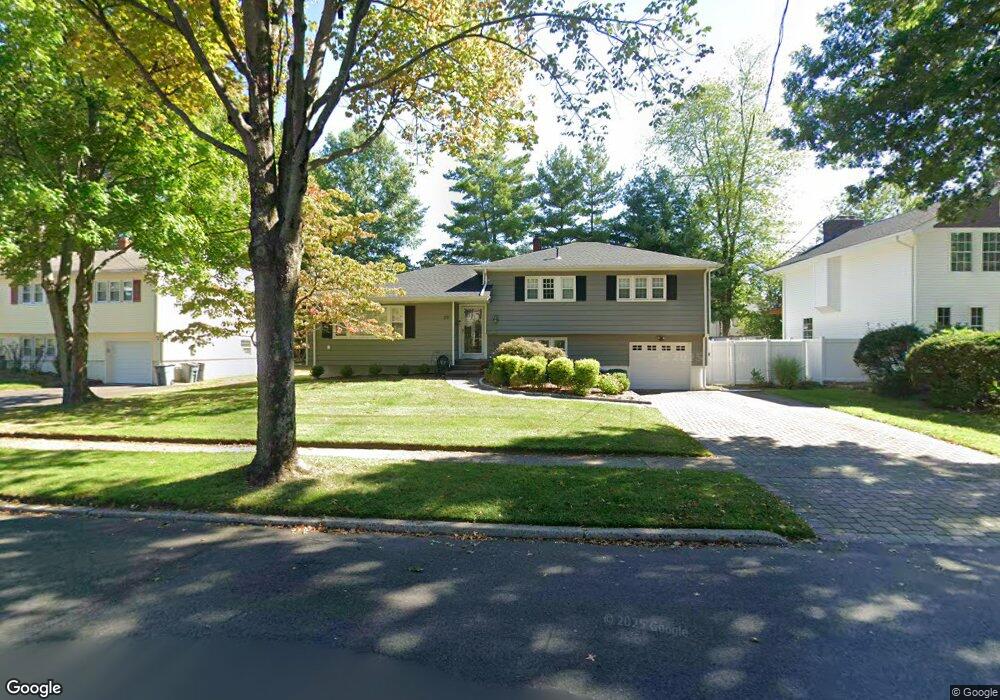
20 Coles Ct River Edge, NJ 07661
Estimated Value: $623,000 - $840,342
--
Bed
--
Bath
1,948
Sq Ft
$386/Sq Ft
Est. Value
About This Home
This home is located at 20 Coles Ct, River Edge, NJ 07661 and is currently estimated at $752,336, approximately $386 per square foot. 20 Coles Ct is a home located in Bergen County with nearby schools including Cherry Hill School, River Dell Middle School, and River Dell Regional High School.
Ownership History
Date
Name
Owned For
Owner Type
Purchase Details
Closed on
Dec 4, 2015
Sold by
Chung Yonjai and Kang Kyongha
Bought by
Kang Holly
Current Estimated Value
Home Financials for this Owner
Home Financials are based on the most recent Mortgage that was taken out on this home.
Original Mortgage
$250,000
Outstanding Balance
$197,839
Interest Rate
3.89%
Mortgage Type
New Conventional
Estimated Equity
$554,497
Purchase Details
Closed on
Nov 12, 2007
Sold by
Kang Kris
Bought by
Kang Kyongha
Purchase Details
Closed on
Sep 27, 2007
Sold by
Kang Kyongha
Bought by
Terrents Jason
Purchase Details
Closed on
Apr 30, 1996
Sold by
Barovick Stuart and Barovick Barry
Bought by
Kang Kyong Ha and Kang Kris
Home Financials for this Owner
Home Financials are based on the most recent Mortgage that was taken out on this home.
Original Mortgage
$180,000
Interest Rate
7.82%
Create a Home Valuation Report for This Property
The Home Valuation Report is an in-depth analysis detailing your home's value as well as a comparison with similar homes in the area
Home Values in the Area
Average Home Value in this Area
Purchase History
| Date | Buyer | Sale Price | Title Company |
|---|---|---|---|
| Kang Holly | $336,000 | Attorney | |
| Kang Kyongha | $10,000 | -- | |
| Terrents Jason | $220,000 | -- | |
| Kang Kyong Ha | $245,000 | -- |
Source: Public Records
Mortgage History
| Date | Status | Borrower | Loan Amount |
|---|---|---|---|
| Open | Kang Holly | $250,000 | |
| Previous Owner | Kang Kyong Ha | $180,000 |
Source: Public Records
Tax History Compared to Growth
Tax History
| Year | Tax Paid | Tax Assessment Tax Assessment Total Assessment is a certain percentage of the fair market value that is determined by local assessors to be the total taxable value of land and additions on the property. | Land | Improvement |
|---|---|---|---|---|
| 2025 | $14,417 | $558,400 | $330,800 | $227,600 |
| 2024 | $14,057 | $363,600 | $203,200 | $160,400 |
| 2023 | $13,453 | $363,600 | $203,200 | $160,400 |
| 2022 | $13,453 | $363,600 | $203,200 | $160,400 |
| 2021 | $12,188 | $363,600 | $203,200 | $160,400 |
| 2020 | $12,981 | $363,600 | $203,200 | $160,400 |
| 2019 | $12,610 | $363,600 | $203,200 | $160,400 |
| 2018 | $12,344 | $363,600 | $203,200 | $160,400 |
| 2017 | $12,224 | $363,600 | $203,200 | $160,400 |
| 2016 | $11,948 | $363,600 | $203,200 | $160,400 |
| 2015 | $11,697 | $363,600 | $203,200 | $160,400 |
| 2014 | $11,719 | $363,600 | $203,200 | $160,400 |
Source: Public Records
Map
Nearby Homes
- 16 Coles Ct
- 42 Eastbrook Dr
- 192 Valley Rd
- 81 Eastbrook Dr
- 165 Mohawk Dr
- 205 Davis Ave
- 302 Howland Ave
- 56 Lilac Ln
- 187 Crest Dr
- 212 Lozier Terrace
- 187 Brookfield Ave
- 214 Zabriskie Place
- 222 Zabriskie Place
- 811 Summit Ave
- 824 Summit Ave
- 122 Village Cir E
- 255 Bogert Rd Unit 2A
- 12 Gainesborough Terrace Unit 1B
- 293 Bogert Rd Unit 1A
- 421 Lafayette Ave