Estimated Value: $196,000 - $285,000
--
Bed
--
Bath
1,458
Sq Ft
$169/Sq Ft
Est. Value
About This Home
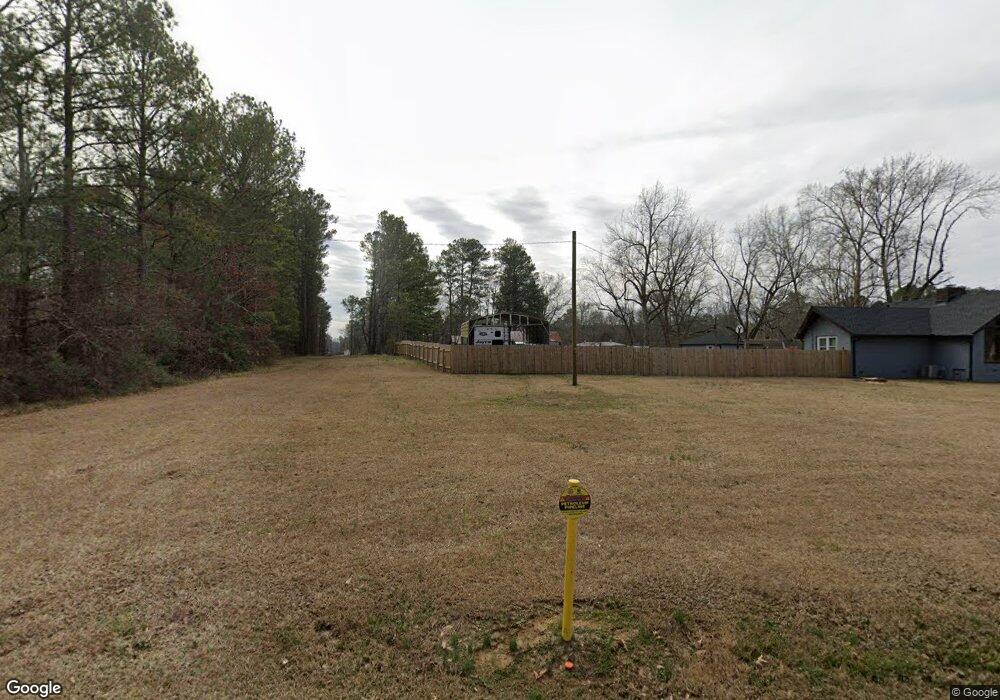
This home is located at 20 Collier Rd NE, Rome, GA 30165 and is currently estimated at $247,000, approximately $169 per square foot. 20 Collier Rd NE is a home located in Floyd County with nearby schools including Armuchee Middle School and Armuchee High School.
Ownership History
Date
Name
Owned For
Owner Type
Purchase Details
Closed on
Sep 14, 2016
Sold by
Smith Gerald Ray
Bought by
Kight Andy S and Kight Tracy L
Current Estimated Value
Home Financials for this Owner
Home Financials are based on the most recent Mortgage that was taken out on this home.
Original Mortgage
$96,800
Outstanding Balance
$77,320
Interest Rate
3.43%
Mortgage Type
New Conventional
Estimated Equity
$169,680
Purchase Details
Closed on
Oct 2, 2008
Sold by
Smith Christine
Bought by
Smith Jerry and Smith Christine
Purchase Details
Closed on
May 5, 1988
Sold by
Smith Jerry R
Bought by
Smith Jerry R and Smith Christine
Purchase Details
Closed on
Jun 12, 1970
Sold by
Griffin Ada Bell
Bought by
Smith Jerry R
Purchase Details
Closed on
Jan 1, 1958
Sold by
Griffin E P Mrs
Bought by
Griffin Ada Bell
Purchase Details
Closed on
Jan 2, 1945
Bought by
P and R
Purchase Details
Closed on
Jan 1, 1945
Bought by
Griffin E P Mrs
Create a Home Valuation Report for This Property
The Home Valuation Report is an in-depth analysis detailing your home's value as well as a comparison with similar homes in the area
Home Values in the Area
Average Home Value in this Area
Purchase History
| Date | Buyer | Sale Price | Title Company |
|---|---|---|---|
| Kight Andy S | $121,000 | -- | |
| Smith Jerry | -- | -- | |
| Smith Jerry R | -- | -- | |
| Smith Jerry R | $4,300 | -- | |
| Griffin Ada Bell | -- | -- | |
| P | -- | -- | |
| Griffin E P Mrs | -- | -- |
Source: Public Records
Mortgage History
| Date | Status | Borrower | Loan Amount |
|---|---|---|---|
| Open | Kight Andy S | $96,800 |
Source: Public Records
Tax History Compared to Growth
Tax History
| Year | Tax Paid | Tax Assessment Tax Assessment Total Assessment is a certain percentage of the fair market value that is determined by local assessors to be the total taxable value of land and additions on the property. | Land | Improvement |
|---|---|---|---|---|
| 2024 | $2,584 | $90,306 | $13,900 | $76,406 |
| 2023 | $2,118 | $73,877 | $12,636 | $61,241 |
| 2022 | $1,886 | $63,573 | $10,109 | $53,464 |
| 2021 | $1,613 | $53,446 | $10,109 | $43,337 |
| 2020 | $1,429 | $46,952 | $7,582 | $39,370 |
| 2019 | $1,332 | $44,338 | $7,582 | $36,756 |
| 2018 | $1,280 | $42,552 | $7,582 | $34,970 |
| 2017 | $1,092 | $36,238 | $7,582 | $28,656 |
| 2016 | $838 | $27,472 | $4,120 | $23,352 |
| 2015 | -- | $27,472 | $4,120 | $23,352 |
| 2014 | -- | $27,472 | $4,120 | $23,352 |
Source: Public Records
Map
Nearby Homes
- 20 Collier Rd NE
- 0 Scott Dr NE
- 11 Don Dr NE
- 27 Boxwood Ln NE
- 1 Wynnie Rd NE
- 263 E Big Indian Trail NE
- 20 Pippin Place NE
- 264 E Big Indian Trail NE
- 12 Applewood Dr NE
- 144 Rising Fawn Trail NE
- 42 Pippin Place NE
- 3 Harbour Rd NE
- 31 Tency Ln NE
- 65 Tency Ln NE
- 16 Sproull St NE
- 23 Whistling Oaks Dr NE
- 25 Majestic Oaks Way NE
- 8 Mossy Oaks Ln NE
- 9 Royal Oak Dr NE
- 12 Majestic Oaks Way NE
- 3 Green Acre Rd NE
- 7 Green Acre Rd NE
- 1A Green Acre Rd NE
- 52 Collier Rd NE
- 9 Green Acre Rd NE
- 46 Collier Rd NE
- 1 Green Acre Rd NE
- 2 Green Acre Rd NE
- 11 Green Acre Rd NE
- 4 Green Acre Rd NE
- 6 Green Acre Rd NE
- 64 Collier Rd NE
- 1542 Old Dalton Rd NE
- 2 Collier Rd NE
- 8 Green Acre Rd NE
- 13 Green Acre Rd NE
- 74 Collier Rd NE
- 10 Green Acre Rd NE
- 84 Collier Rd NE
- 73 Collier Rd NE