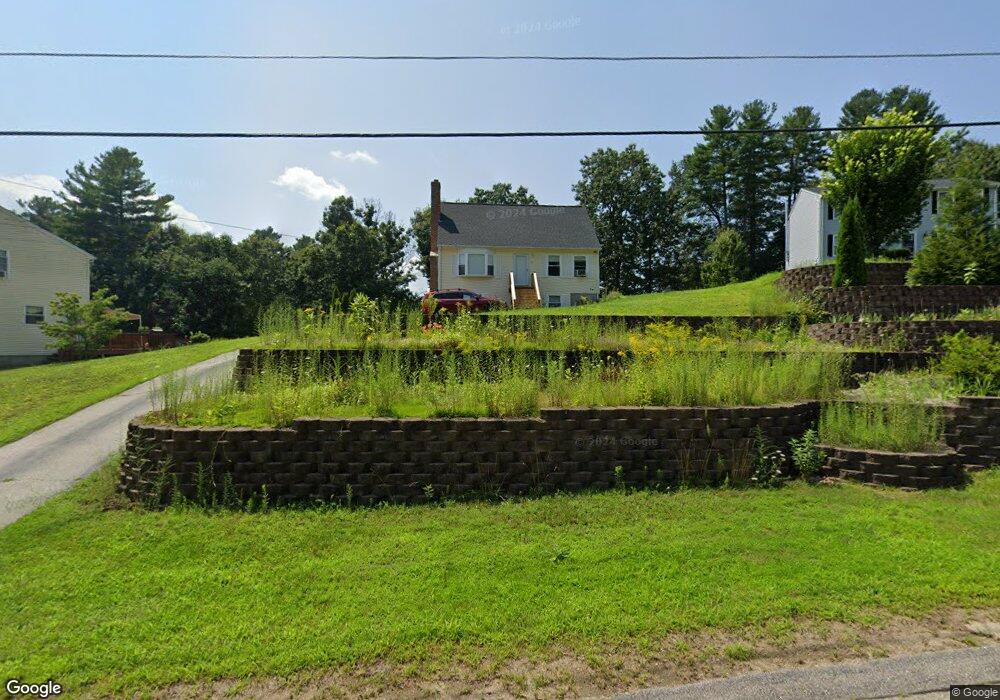
20 Colonial Rd Douglas, MA 01516
Estimated Value: $494,000 - $582,000
3
Beds
2
Baths
1,547
Sq Ft
$344/Sq Ft
Est. Value
About This Home
This home is located at 20 Colonial Rd, Douglas, MA 01516 and is currently estimated at $531,572, approximately $343 per square foot. 20 Colonial Rd is a home located in Worcester County with nearby schools including Douglas Primary School, Douglas Middle School, and Douglas High School.
Ownership History
Date
Name
Owned For
Owner Type
Purchase Details
Closed on
Jul 11, 2014
Sold by
Coe Angela M
Bought by
Coe 3Rd Raymond
Current Estimated Value
Purchase Details
Closed on
Jan 21, 2005
Sold by
Menard Donna M and Menard Joel D
Bought by
White Angela and Coe Raymond
Home Financials for this Owner
Home Financials are based on the most recent Mortgage that was taken out on this home.
Original Mortgage
$216,000
Interest Rate
5.71%
Mortgage Type
Purchase Money Mortgage
Purchase Details
Closed on
Dec 30, 1994
Sold by
Kentco Dev Inc
Bought by
Menard Joel and Menard Donna
Purchase Details
Closed on
Oct 3, 1994
Sold by
Kentco Dev Inc
Bought by
Lamont Kenneth W
Create a Home Valuation Report for This Property
The Home Valuation Report is an in-depth analysis detailing your home's value as well as a comparison with similar homes in the area
Home Values in the Area
Average Home Value in this Area
Purchase History
| Date | Buyer | Sale Price | Title Company |
|---|---|---|---|
| Coe 3Rd Raymond | -- | -- | |
| White Angela | $270,000 | -- | |
| Menard Joel | $125,000 | -- | |
| Lamont Kenneth W | $122,900 | -- |
Source: Public Records
Mortgage History
| Date | Status | Borrower | Loan Amount |
|---|---|---|---|
| Previous Owner | Lamont Kenneth W | $225,000 | |
| Previous Owner | White Angela | $216,000 | |
| Previous Owner | Lamont Kenneth W | $110,700 | |
| Previous Owner | Lamont Kenneth W | $112,200 |
Source: Public Records
Tax History
| Year | Tax Paid | Tax Assessment Tax Assessment Total Assessment is a certain percentage of the fair market value that is determined by local assessors to be the total taxable value of land and additions on the property. | Land | Improvement |
|---|---|---|---|---|
| 2025 | $57 | $430,100 | $115,400 | $314,700 |
| 2024 | $5,568 | $411,800 | $104,900 | $306,900 |
| 2023 | $5,470 | $380,900 | $104,900 | $276,000 |
| 2022 | $5,286 | $323,500 | $86,800 | $236,700 |
| 2021 | $5,230 | $312,800 | $82,700 | $230,100 |
| 2020 | $5,822 | $301,400 | $82,700 | $218,700 |
| 2019 | $4,972 | $284,100 | $82,700 | $201,400 |
| 2018 | $5,305 | $277,200 | $82,700 | $194,500 |
| 2017 | $5,057 | $253,800 | $80,100 | $173,700 |
| 2016 | $4,129 | $245,500 | $80,100 | $165,400 |
| 2015 | $4,041 | $245,500 | $80,100 | $165,400 |
Source: Public Records
Map
Nearby Homes
- 26 Compass Point Dr Unit 26
- 36 Compass Point Dr Unit 36
- 33 Nautical Way Unit 107
- 22 Gilboa St
- 8 Hough Rd
- 5 B St
- 408 NE Main St
- 2 White Ct
- 41 Martin Rd
- 108 Mumford St
- 80 Barnett Rd
- 4 1st St
- 201 Prescott Rd
- 37 Bayliss Way
- 99 Maple St
- 22 Bayliss Way
- 19 Birch St
- 28 Johnson Rd
- 153 Davis St
- 3 S East Main St
Your Personal Tour Guide
Ask me questions while you tour the home.