Estimated Value: $380,719 - $450,000
Studio
3
Baths
2,616
Sq Ft
$160/Sq Ft
Est. Value
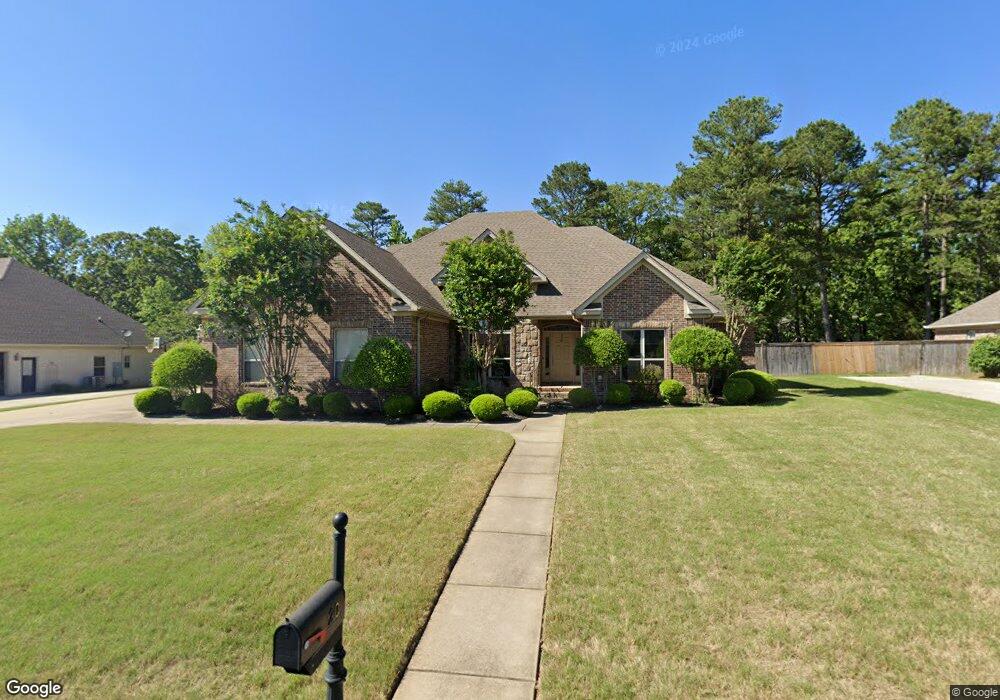
About This Home
This home is located at 20 Cossatot Cir, Cabot, AR 72023 and is currently estimated at $418,680, approximately $160 per square foot. 20 Cossatot Cir is a home located in Lonoke County with nearby schools including Mountain Springs Elementary School, Cabot Junior High North, and Cabot Middle School North.
Ownership History
Date
Name
Owned For
Owner Type
Purchase Details
Closed on
Oct 10, 2008
Sold by
Dawson Joel S and Dawson Kendra R
Bought by
Robert Sandra L
Current Estimated Value
Home Financials for this Owner
Home Financials are based on the most recent Mortgage that was taken out on this home.
Original Mortgage
$206,000
Outstanding Balance
$137,576
Interest Rate
6.52%
Estimated Equity
$281,104
Purchase Details
Closed on
Mar 12, 2008
Sold by
Dawson Joel S and Dawson Kendra R
Bought by
Robert Sandra L
Home Financials for this Owner
Home Financials are based on the most recent Mortgage that was taken out on this home.
Original Mortgage
$206,000
Interest Rate
6.52%
Purchase Details
Closed on
May 30, 2006
Bought by
Dawson and Wf Kendra
Purchase Details
Closed on
May 23, 2006
Bought by
Dawson and Wf Kendra
Purchase Details
Closed on
Mar 23, 2005
Bought by
Taylor Made
Purchase Details
Closed on
Sep 22, 2004
Bought by
Pci-774
Create a Home Valuation Report for This Property
The Home Valuation Report is an in-depth analysis detailing your home's value as well as a comparison with similar homes in the area
Purchase History
| Date | Buyer | Sale Price | Title Company |
|---|---|---|---|
| Robert Sandra L | -- | -- | |
| Robert Sandra L | -- | -- | |
| Dawson | $270,000 | -- | |
| Dawson | $270,000 | -- | |
| Taylor Made | $39,000 | -- | |
| Pci-774 | -- | -- |
Source: Public Records
Mortgage History
| Date | Status | Borrower | Loan Amount |
|---|---|---|---|
| Open | Robert Sandra L | $206,000 | |
| Previous Owner | Robert Sandra L | $206,000 |
Source: Public Records
Tax History
| Year | Tax Paid | Tax Assessment Tax Assessment Total Assessment is a certain percentage of the fair market value that is determined by local assessors to be the total taxable value of land and additions on the property. | Land | Improvement |
|---|---|---|---|---|
| 2025 | $2,191 | $54,190 | $6,400 | $47,790 |
| 2024 | $2,191 | $54,190 | $6,400 | $47,790 |
| 2023 | $2,191 | $54,190 | $6,400 | $47,790 |
| 2022 | $2,241 | $54,190 | $6,400 | $47,790 |
| 2021 | $2,241 | $54,190 | $6,400 | $47,790 |
| 2020 | $2,235 | $51,280 | $6,400 | $44,880 |
| 2019 | $2,235 | $51,280 | $6,400 | $44,880 |
| 2018 | $2,183 | $51,280 | $6,400 | $44,880 |
| 2017 | $2,354 | $51,280 | $6,400 | $44,880 |
| 2016 | $2,183 | $51,280 | $6,400 | $44,880 |
| 2015 | $2,189 | $51,390 | $7,800 | $43,590 |
| 2014 | $2,189 | $51,390 | $7,800 | $43,590 |
Source: Public Records
Map
Nearby Homes
- 21 Blanchard Dr
- 35 N Sunland Dr
- 18 Suncrest Dr
- 505 Sweet Gum Ct
- 509 Crepe Myrtle Loop
- 504 Sweet Gum Ct
- 24 Sunset Ln
- 519 Crepe Myrtle Loop
- 582 Crepe Myrtle Loop
- 41 Sunset Ln
- 105 Epperson Dr
- 0 N Rockwood Rd Unit W. Main Street
- 311 Mountain Springs Rd
- 0 Tract F Hwy 89
- 0 Tract G Hwy 89
- 0 Tract E Hwy 89
- 0 Tract C Hwy 89
- 296 Deer Creek Dr
- Lot 19 Kelly Ct
- Lot 20 Kelly Ct
- 18 Cossatot Cir
- 22 Cossatot Cir
- 19 Cossatot Cir
- 24 Cossatot Cir
- 16 Cossatot Cir
- 21 Cossatot Cir
- 1385 Mountain Springs Rd
- 1299 Mountain Springs Rd
- 15 Cossatot Cir
- 23 Cossatot Cir
- 14 Cossatot Cir
- 26 Cossatot Cir
- 18 Blanchard Dr
- 16 Blanchard Dr
- 20 Blanchard Dr
- 13 Cossatot Cir
- 0 Blanchard Dr Unit 17007143
- 0 Blanchard Dr Unit 17006998
- 25 Cossatot Cir
- 28 Cossatot Cir
Your Personal Tour Guide
Ask me questions while you tour the home.