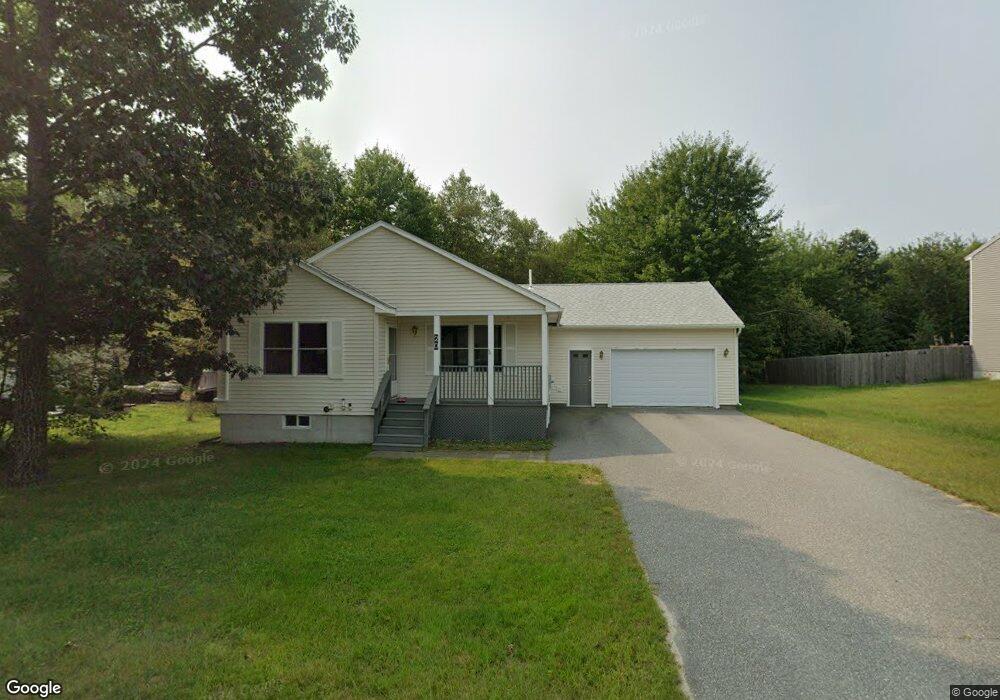
20 Crabtree Dr Topsham, ME 04086
Estimated Value: $435,511 - $617,000
2
Beds
2
Baths
1,288
Sq Ft
$384/Sq Ft
Est. Value
About This Home
This home is located at 20 Crabtree Dr, Topsham, ME 04086 and is currently estimated at $494,378, approximately $383 per square foot. 20 Crabtree Dr is a home located in Sagadahoc County with nearby schools including Mt Ararat High School and St. John's Catholic School.
Ownership History
Date
Name
Owned For
Owner Type
Purchase Details
Closed on
Dec 5, 2018
Sold by
Grover Christopher
Bought by
Deschenes Kelly E
Current Estimated Value
Home Financials for this Owner
Home Financials are based on the most recent Mortgage that was taken out on this home.
Original Mortgage
$153,300
Outstanding Balance
$134,531
Interest Rate
4.8%
Mortgage Type
Purchase Money Mortgage
Estimated Equity
$359,847
Purchase Details
Closed on
Dec 28, 2010
Sold by
Keisacker Jennifer E
Bought by
Grover Christopher and Deschenes Kelly
Home Financials for this Owner
Home Financials are based on the most recent Mortgage that was taken out on this home.
Original Mortgage
$174,093
Interest Rate
4.17%
Mortgage Type
FHA
Purchase Details
Closed on
Jul 5, 2005
Sold by
Merrymeeting Assoc Dev
Bought by
Keisacker Jennifer E
Home Financials for this Owner
Home Financials are based on the most recent Mortgage that was taken out on this home.
Original Mortgage
$160,000
Interest Rate
5.73%
Mortgage Type
Purchase Money Mortgage
Create a Home Valuation Report for This Property
The Home Valuation Report is an in-depth analysis detailing your home's value as well as a comparison with similar homes in the area
Home Values in the Area
Average Home Value in this Area
Purchase History
| Date | Buyer | Sale Price | Title Company |
|---|---|---|---|
| Deschenes Kelly E | -- | -- | |
| Grover Christopher | -- | -- | |
| Keisacker Jennifer E | -- | -- |
Source: Public Records
Mortgage History
| Date | Status | Borrower | Loan Amount |
|---|---|---|---|
| Open | Deschenes Kelly E | $153,300 | |
| Previous Owner | Grover Christopher | $174,093 | |
| Previous Owner | Keisacker Jennifer E | $160,000 |
Source: Public Records
Tax History Compared to Growth
Tax History
| Year | Tax Paid | Tax Assessment Tax Assessment Total Assessment is a certain percentage of the fair market value that is determined by local assessors to be the total taxable value of land and additions on the property. | Land | Improvement |
|---|---|---|---|---|
| 2025 | $4,745 | $370,700 | $56,200 | $314,500 |
| 2024 | $4,619 | $369,500 | $52,100 | $317,400 |
| 2023 | $4,384 | $322,800 | $49,600 | $273,200 |
| 2022 | $3,986 | $276,400 | $47,900 | $228,500 |
| 2021 | $3,968 | $250,000 | $44,000 | $206,000 |
| 2020 | $3,799 | $212,700 | $44,000 | $168,700 |
| 2019 | $3,817 | $199,300 | $44,000 | $155,300 |
| 2018 | $3,452 | $184,300 | $39,200 | $145,100 |
| 2017 | $3,340 | $184,300 | $39,200 | $145,100 |
| 2016 | $3,287 | $182,700 | $39,200 | $143,500 |
| 2015 | $3,199 | $178,100 | $39,200 | $138,900 |
| 2014 | $3,059 | $176,500 | $39,200 | $137,300 |
| 2013 | $2,939 | $176,500 | $39,200 | $137,300 |
Source: Public Records
Map
Nearby Homes
- 16 Crabtree Dr
- 24 Crabtree Dr
- 14 Crabtree Dr
- 19 Crabtree Dr
- 26 Crabtree Dr
- 15 Crabtree Dr
- 25 Crabtree Dr
- 12 Crabtree Dr
- 13 Crabtree Dr
- 28 Crabtree Dr
- 18 Hemlock Dr
- 27 Crabtree Dr
- 17 Hemlock Dr
- 10 Crabtree Dr
- 11 Crabtree Dr
- 32 Crabtree Dr
- 16 Hemlock Dr
- 33 Topsham Crossing
- 15 Hemlock Dr
- 1 Hawthorne Ln