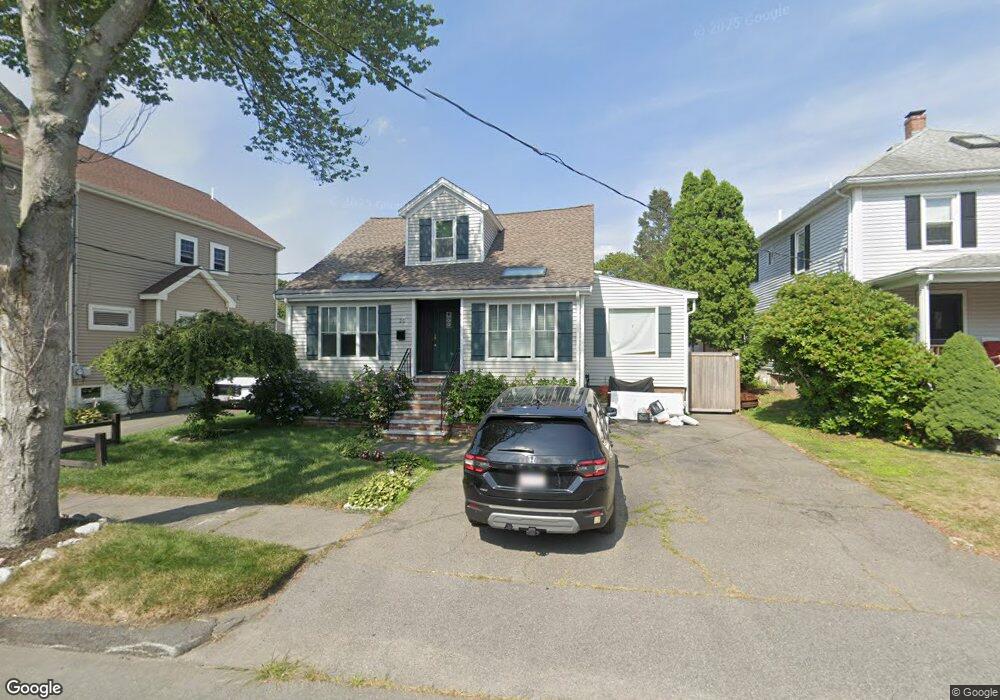
20 Crane St Danvers, MA 01923
Estimated Value: $680,324 - $727,000
3
Beds
3
Baths
1,751
Sq Ft
$399/Sq Ft
Est. Value
About This Home
This home is located at 20 Crane St, Danvers, MA 01923 and is currently estimated at $698,831, approximately $399 per square foot. 20 Crane St is a home located in Essex County with nearby schools including Danvers High School, St. Mary of the Annunciation School, and Bishop Fenwick High School.
Ownership History
Date
Name
Owned For
Owner Type
Purchase Details
Closed on
Dec 28, 2007
Sold by
Lyman Matthew A and Lyman Ruth A
Bought by
Danish Mark and Palm Kristyna
Current Estimated Value
Home Financials for this Owner
Home Financials are based on the most recent Mortgage that was taken out on this home.
Original Mortgage
$386,000
Outstanding Balance
$240,579
Interest Rate
6.18%
Estimated Equity
$458,252
Purchase Details
Closed on
Aug 23, 2004
Sold by
Hill Erin K and Hill Ryan A
Bought by
Lyman Matthew A and Lyman Ruth A
Purchase Details
Closed on
May 31, 2001
Sold by
Mizioch John J and Mizioch Mary T
Bought by
Hill Ryan A and Hill Erin K
Purchase Details
Closed on
Feb 5, 1999
Sold by
Sirois Kim E and Sirois Jeffrey S
Bought by
Mizioch John J and Mizioch Mary T
Purchase Details
Closed on
Aug 20, 1990
Sold by
Toomey George F
Bought by
Parisi Darla K
Create a Home Valuation Report for This Property
The Home Valuation Report is an in-depth analysis detailing your home's value as well as a comparison with similar homes in the area
Home Values in the Area
Average Home Value in this Area
Purchase History
| Date | Buyer | Sale Price | Title Company |
|---|---|---|---|
| Danish Mark | $386,000 | -- | |
| Lyman Matthew A | $385,000 | -- | |
| Hill Ryan A | $285,500 | -- | |
| Mizioch John J | $220,000 | -- | |
| Parisi Darla K | $5,000 | -- |
Source: Public Records
Mortgage History
| Date | Status | Borrower | Loan Amount |
|---|---|---|---|
| Open | Parisi Darla K | $386,000 |
Source: Public Records
Tax History
| Year | Tax Paid | Tax Assessment Tax Assessment Total Assessment is a certain percentage of the fair market value that is determined by local assessors to be the total taxable value of land and additions on the property. | Land | Improvement |
|---|---|---|---|---|
| 2025 | $6,439 | $585,900 | $326,300 | $259,600 |
| 2024 | $6,282 | $565,400 | $315,000 | $250,400 |
| 2023 | $5,944 | $505,900 | $284,600 | $221,300 |
| 2022 | $5,857 | $462,600 | $258,800 | $203,800 |
| 2021 | $5,680 | $425,500 | $246,400 | $179,100 |
| 2020 | $5,557 | $425,500 | $246,400 | $179,100 |
| 2019 | $5,276 | $397,300 | $213,800 | $183,500 |
| 2018 | $5,067 | $374,200 | $213,800 | $160,400 |
| 2017 | $4,954 | $349,100 | $194,600 | $154,500 |
| 2016 | $4,768 | $335,800 | $185,600 | $150,200 |
| 2015 | $4,501 | $301,900 | $163,100 | $138,800 |
Source: Public Records
Map
Nearby Homes
- 108 Abington Rd Unit 108
- 11 Riverside Ave Unit 111
- 34 Bayview Terrace Unit 5
- 147 High St
- 35 High St Unit 3D
- 5 Holten St
- 7 Riverbank Ave Unit 7
- 63 Adams St
- 97 Sylvan St Unit 7
- 14 Williams St Unit C17
- 43 Hobart St Unit B
- 152 Endicott St
- 76 Water St
- 22 Maple Ave
- 6 Venice St Unit B3
- 35 Locust St Unit 3
- 10 Clark St
- 6 Mcdewell Ave Unit 4
- 14 Grove St
- 2 Chapel Rd
Your Personal Tour Guide
Ask me questions while you tour the home.