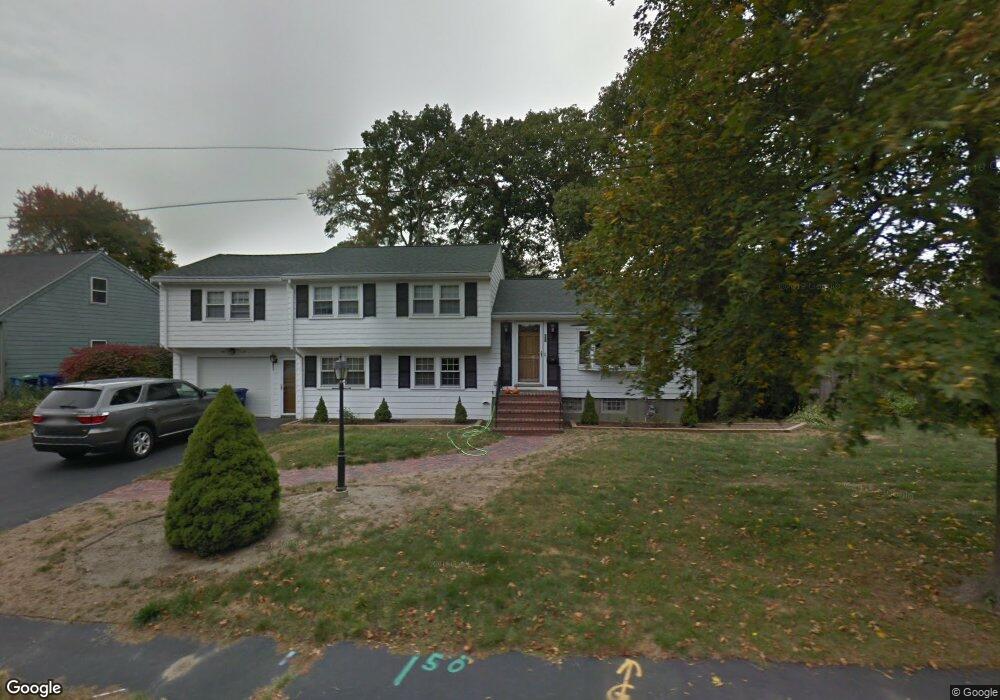
20 Cranmore Rd Braintree, MA 02184
Braintree Highlands NeighborhoodEstimated Value: $808,107 - $1,024,000
4
Beds
2
Baths
2,400
Sq Ft
$382/Sq Ft
Est. Value
About This Home
This home is located at 20 Cranmore Rd, Braintree, MA 02184 and is currently estimated at $917,277, approximately $382 per square foot. 20 Cranmore Rd is a home located in Norfolk County with nearby schools including Braintree High School, Boston Higashi School, and Lighthouse Baptist Christian Academy.
Ownership History
Date
Name
Owned For
Owner Type
Purchase Details
Closed on
Dec 19, 2011
Sold by
Ward Daniel I
Bought by
Wellington Sean M and Wellington Devon M
Current Estimated Value
Home Financials for this Owner
Home Financials are based on the most recent Mortgage that was taken out on this home.
Original Mortgage
$324,800
Outstanding Balance
$222,185
Interest Rate
4.01%
Mortgage Type
Purchase Money Mortgage
Estimated Equity
$695,092
Create a Home Valuation Report for This Property
The Home Valuation Report is an in-depth analysis detailing your home's value as well as a comparison with similar homes in the area
Home Values in the Area
Average Home Value in this Area
Purchase History
| Date | Buyer | Sale Price | Title Company |
|---|---|---|---|
| Wellington Sean M | $406,000 | -- |
Source: Public Records
Mortgage History
| Date | Status | Borrower | Loan Amount |
|---|---|---|---|
| Open | Wellington Sean M | $324,800 |
Source: Public Records
Tax History
| Year | Tax Paid | Tax Assessment Tax Assessment Total Assessment is a certain percentage of the fair market value that is determined by local assessors to be the total taxable value of land and additions on the property. | Land | Improvement |
|---|---|---|---|---|
| 2025 | $7,231 | $724,500 | $412,200 | $312,300 |
| 2024 | $6,579 | $694,000 | $386,500 | $307,500 |
| 2023 | $6,047 | $619,600 | $340,100 | $279,500 |
| 2022 | $5,858 | $588,700 | $309,200 | $279,500 |
| 2021 | $5,338 | $536,500 | $260,700 | $275,800 |
| 2020 | $5,290 | $536,500 | $260,700 | $275,800 |
| 2019 | $5,322 | $527,500 | $260,700 | $266,800 |
| 2018 | $5,083 | $482,300 | $226,700 | $255,600 |
| 2017 | $4,778 | $444,900 | $206,100 | $238,800 |
| 2016 | $4,821 | $439,100 | $185,500 | $253,600 |
| 2015 | $4,815 | $435,000 | $181,400 | $253,600 |
| 2014 | $4,397 | $385,000 | $166,900 | $218,100 |
Source: Public Records
Map
Nearby Homes
- 24 Evelyn Ln
- 38 Roosevelt St
- 1696 Liberty St
- 39 Canavan Dr
- 129 Albee Dr
- 8 Dianthus Rd
- 1579 Washington St
- 15 Alida Rd
- 278 N Franklin St
- 1 Geraldine Ln
- 23 Portland Rd
- 661 North St
- 5 Clarendon Cir Unit Lot 4
- 20 Isabelle Ave
- 12 Brewster Rd
- 107 Meadow Ln Unit 107
- 700 North St
- 469 North St
- 123-125 N Franklin St
- 120 Roberts Ave
Your Personal Tour Guide
Ask me questions while you tour the home.