20 Creekside Way SE Moultrie, GA 31788
Estimated Value: $287,125 - $340,000
--
Bed
--
Bath
1,641
Sq Ft
$190/Sq Ft
Est. Value
About This Home
This home is located at 20 Creekside Way SE, Moultrie, GA 31788 and is currently estimated at $312,531, approximately $190 per square foot. 20 Creekside Way SE is a home with nearby schools including Sunset Elementary School, Willie J. Williams Middle School, and C.A. Gray Junior High School.
Ownership History
Date
Name
Owned For
Owner Type
Purchase Details
Closed on
Dec 17, 2021
Sold by
Bortle Daniel A
Bought by
Nichols Penny J and Nichols Mark S
Current Estimated Value
Home Financials for this Owner
Home Financials are based on the most recent Mortgage that was taken out on this home.
Original Mortgage
$203,920
Outstanding Balance
$187,553
Interest Rate
3.11%
Mortgage Type
New Conventional
Estimated Equity
$124,978
Purchase Details
Closed on
Dec 27, 2017
Sold by
James Nellis
Bought by
Bortle Daniel A and Bortle Charisse L
Home Financials for this Owner
Home Financials are based on the most recent Mortgage that was taken out on this home.
Original Mortgage
$101,600
Interest Rate
3.9%
Mortgage Type
New Conventional
Purchase Details
Closed on
Jun 18, 2013
Sold by
Larry Franklin Properties
Bought by
Nellis James and Nellis Karen
Purchase Details
Closed on
Jun 14, 2007
Bought by
Larry Franklin Properties Inc
Create a Home Valuation Report for This Property
The Home Valuation Report is an in-depth analysis detailing your home's value as well as a comparison with similar homes in the area
Home Values in the Area
Average Home Value in this Area
Purchase History
| Date | Buyer | Sale Price | Title Company |
|---|---|---|---|
| Nichols Penny J | $254,900 | -- | |
| Bortle Daniel A | $155,000 | -- | |
| Nellis James | $184,000 | -- | |
| Larry Franklin Properties Inc | -- | -- |
Source: Public Records
Mortgage History
| Date | Status | Borrower | Loan Amount |
|---|---|---|---|
| Open | Nichols Penny J | $203,920 | |
| Previous Owner | Bortle Daniel A | $101,600 |
Source: Public Records
Tax History Compared to Growth
Tax History
| Year | Tax Paid | Tax Assessment Tax Assessment Total Assessment is a certain percentage of the fair market value that is determined by local assessors to be the total taxable value of land and additions on the property. | Land | Improvement |
|---|---|---|---|---|
| 2024 | $3,002 | $105,922 | $13,068 | $92,854 |
| 2023 | $3,153 | $98,422 | $13,068 | $85,354 |
| 2022 | $3,271 | $97,707 | $13,068 | $84,639 |
| 2021 | $2,529 | $79,219 | $13,068 | $66,151 |
| 2020 | $2,277 | $70,714 | $13,068 | $57,646 |
| 2019 | $2,428 | $67,133 | $13,068 | $54,065 |
| 2018 | $2,670 | $66,859 | $13,068 | $53,791 |
| 2017 | $2,617 | $69,636 | $13,068 | $56,568 |
| 2016 | $2,727 | $69,636 | $13,068 | $56,568 |
| 2015 | $2,941 | $60,282 | $13,068 | $47,214 |
| 2014 | $2,962 | $74,800 | $13,118 | $61,681 |
| 2013 | -- | $79,119 | $13,118 | $66,001 |
Source: Public Records
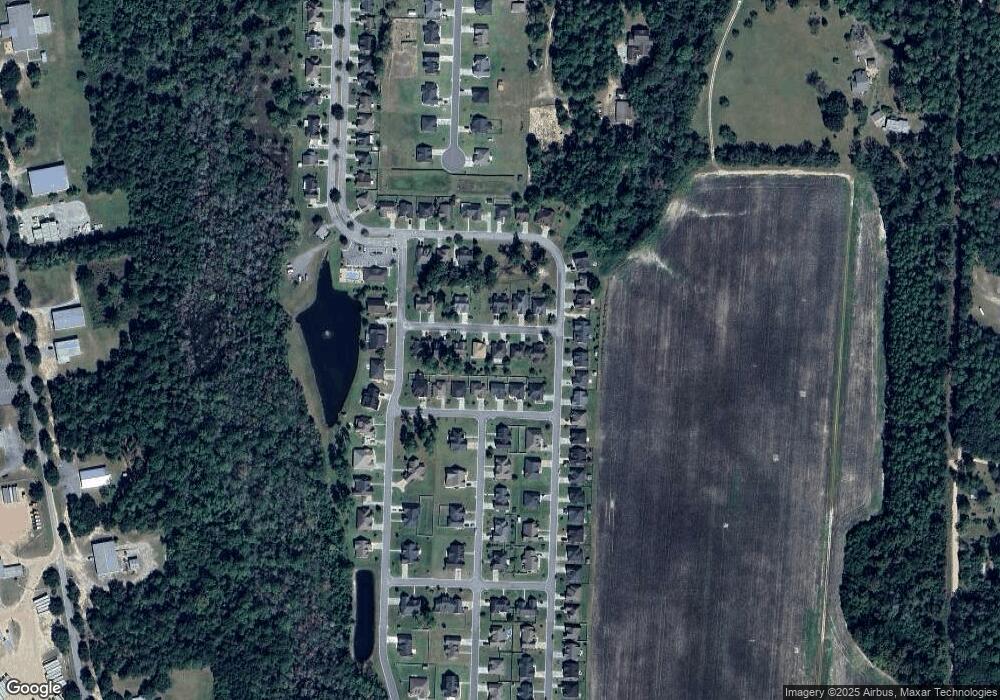
Map
Nearby Homes
- 85 Cobblestone Blvd SE
- 35 Cobblestone Blvd SE
- 16 Francine Way SE
- 72 Packer Pride Dr SE
- 69 Packer Pride Dr SE
- 4 Baldwin Place SE
- 65 Packer Pride Dr SE
- 48 Packer Pride Dr SE
- 31 31st Ave SE
- 149 Tallokas Cir
- 126 Sunset Cir
- 104 Inner Cir
- 125 Inner Cir
- 114 Baell Trace Ct SE
- 7 SE Pheasant Ln
- 0 Old Timey Trail
- 208 Baell Trace Ct SE
- 213 Baell Trace Ct SE
- 132 Tallokas Trail
- 0 26th Ave SE
- 24 Creekside Way SE
- 16 Creekside Way SE
- 19 Taranik Ln SE
- 15 Taranik Ln SE
- 23 Taranik Ln SE
- 12 Creekside Way SE
- 28 Creekside Way SE
- 19 Creekside Way SE
- 23 Creekside Way SE
- 11 Taranik Ln SE
- 8 Creekside Way SE
- 8 Creekside Way SE
- 11 Creekside Way SE
- 27 Creekside Way SE
- 7 Taranik Ln SE
- 4 Creekside Way SE
- 280 Cobblestone Blvd SE
- 276 Cobblestone Blvd SE
- 3 Taranik Ln SE
- 288 Cobblestone Blvd SE