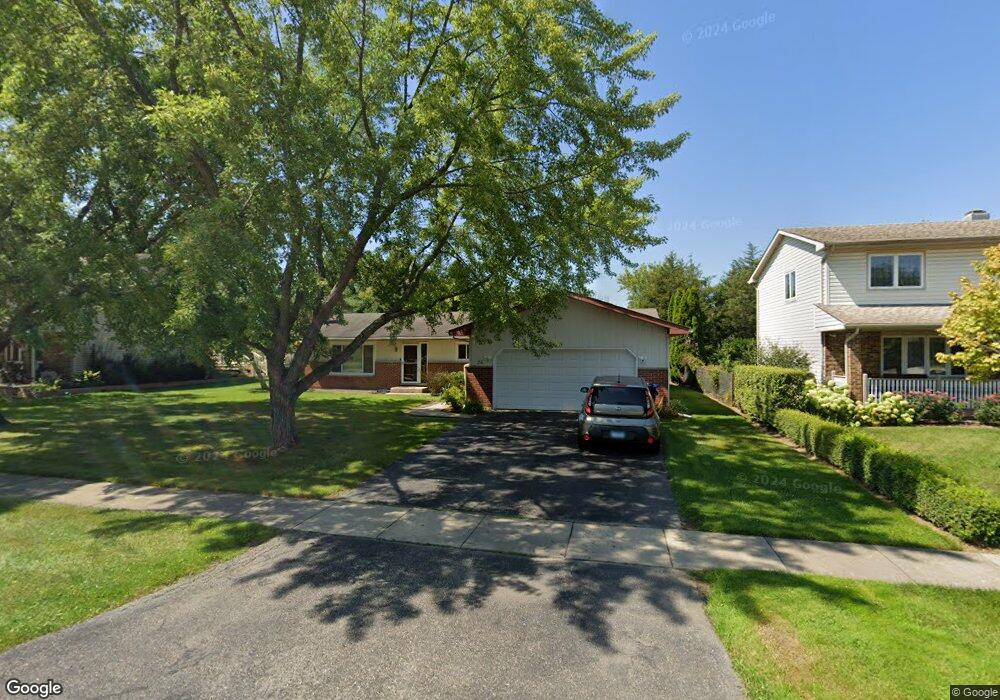
20 Cremin Dr Lake Villa, IL 60046
South Lake Villa NeighborhoodEstimated Value: $304,000 - $340,669
2
Beds
2
Baths
1,508
Sq Ft
$216/Sq Ft
Est. Value
About This Home
This home is located at 20 Cremin Dr, Lake Villa, IL 60046 and is currently estimated at $326,167, approximately $216 per square foot. 20 Cremin Dr is a home located in Lake County with nearby schools including Thompson Elementary School, Palombi Middle School, and Lakes Community High School.
Ownership History
Date
Name
Owned For
Owner Type
Purchase Details
Closed on
May 13, 2011
Sold by
Carlson Gregory William
Bought by
Ellis Tayler L
Current Estimated Value
Home Financials for this Owner
Home Financials are based on the most recent Mortgage that was taken out on this home.
Original Mortgage
$100,000
Outstanding Balance
$69,751
Interest Rate
4.96%
Mortgage Type
New Conventional
Estimated Equity
$256,416
Purchase Details
Closed on
Nov 14, 2003
Sold by
Carlson Betty L
Bought by
Carlson Betty and The Betty Carlson Trust
Purchase Details
Closed on
May 1, 2001
Sold by
Brockway Stephen L and Brockway Janice L
Bought by
Carlson Betty L
Purchase Details
Closed on
Aug 26, 1998
Sold by
Henkel Emil
Bought by
Brockway Stephen L and Brockway Janice L
Home Financials for this Owner
Home Financials are based on the most recent Mortgage that was taken out on this home.
Original Mortgage
$117,000
Interest Rate
7.03%
Create a Home Valuation Report for This Property
The Home Valuation Report is an in-depth analysis detailing your home's value as well as a comparison with similar homes in the area
Home Values in the Area
Average Home Value in this Area
Purchase History
| Date | Buyer | Sale Price | Title Company |
|---|---|---|---|
| Ellis Tayler L | $130,000 | Attorneys Title Guaranty Fun | |
| Carlson Betty | -- | Atg | |
| Carlson Betty L | $165,000 | -- | |
| Brockway Stephen L | $132,000 | -- |
Source: Public Records
Mortgage History
| Date | Status | Borrower | Loan Amount |
|---|---|---|---|
| Open | Ellis Tayler L | $100,000 | |
| Previous Owner | Brockway Stephen L | $117,000 |
Source: Public Records
Tax History Compared to Growth
Tax History
| Year | Tax Paid | Tax Assessment Tax Assessment Total Assessment is a certain percentage of the fair market value that is determined by local assessors to be the total taxable value of land and additions on the property. | Land | Improvement |
|---|---|---|---|---|
| 2024 | $8,211 | $97,417 | $13,264 | $84,153 |
| 2023 | $7,755 | $86,072 | $11,719 | $74,353 |
| 2022 | $7,755 | $77,544 | $9,967 | $67,577 |
| 2021 | $7,358 | $72,034 | $9,259 | $62,775 |
| 2020 | $7,196 | $69,726 | $8,962 | $60,764 |
| 2019 | $7,766 | $67,012 | $8,613 | $58,399 |
| 2018 | $6,765 | $61,887 | $12,140 | $49,747 |
| 2017 | $6,553 | $60,236 | $11,816 | $48,420 |
| 2016 | $6,632 | $58,070 | $11,338 | $46,732 |
| 2015 | $6,373 | $54,235 | $10,589 | $43,646 |
| 2014 | $4,502 | $42,358 | $10,637 | $31,721 |
| 2012 | $4,820 | $42,564 | $11,815 | $30,749 |
Source: Public Records
Map
Nearby Homes
- 18 Sheehan Dr
- 21210 W Grass Lake Rd
- 0 Park Ave
- 234 N Crooked Lake Ln
- 464 N Crooked Lake Ln
- 104 Oak Knoll Dr
- 21990 W 6th St
- 22271 W Terry Dr S
- 21974 W Engle Dr
- 21621 W Cedar Ave
- 36915 N Mary Dr
- 355 Woodhill Ln
- 116 E Monaville Rd
- 21696 W Willow St
- 2651 N Cherry Cove Ln
- 434 Woodland Trail
- 437 Woodland Trail
- 428 Woodland Trail
- 36664 N Helen Dr
- 433 Woodland Trail