Estimated Value: $130,470 - $189,000
--
Bed
2
Baths
1,104
Sq Ft
$144/Sq Ft
Est. Value
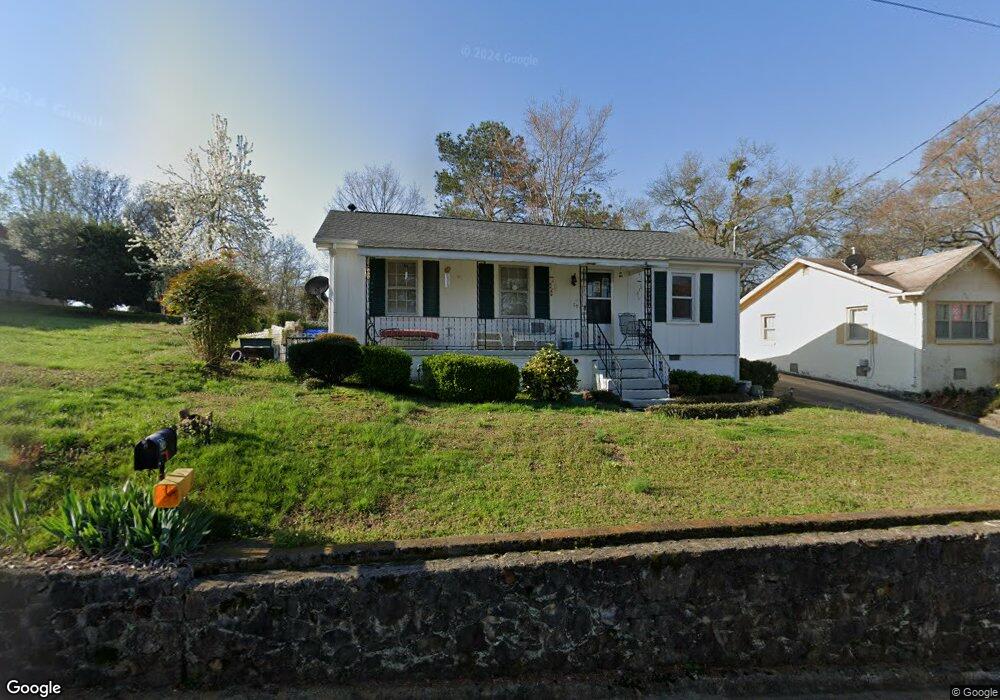
About This Home
This home is located at 20 Crescent Ave SW, Rome, GA 30161 and is currently estimated at $159,118, approximately $144 per square foot. 20 Crescent Ave SW is a home located in Floyd County with nearby schools including Dan McCarty Middle School, Rome High School, and Darlington School.
Ownership History
Date
Name
Owned For
Owner Type
Purchase Details
Closed on
Nov 14, 1983
Sold by
Holsomback Bertha
Bought by
Tant Franziska K
Current Estimated Value
Purchase Details
Closed on
Jan 1, 1978
Sold by
Holsomback Merley B and Holsomback Bertha
Bought by
Holsomback Bertha
Purchase Details
Closed on
Jan 31, 1969
Sold by
Peugh Grady and Peugh Minnie
Bought by
Holsomback Merley B and Holsomback Bertha
Purchase Details
Closed on
Jan 1, 1901
Bought by
Peugh Grady and Peugh Minnie
Create a Home Valuation Report for This Property
The Home Valuation Report is an in-depth analysis detailing your home's value as well as a comparison with similar homes in the area
Home Values in the Area
Average Home Value in this Area
Purchase History
| Date | Buyer | Sale Price | Title Company |
|---|---|---|---|
| Tant Franziska K | $27,000 | -- | |
| Holsomback Bertha | -- | -- | |
| Holsomback Merley B | $8,000 | -- | |
| Peugh Grady | -- | -- |
Source: Public Records
Tax History Compared to Growth
Tax History
| Year | Tax Paid | Tax Assessment Tax Assessment Total Assessment is a certain percentage of the fair market value that is determined by local assessors to be the total taxable value of land and additions on the property. | Land | Improvement |
|---|---|---|---|---|
| 2024 | $536 | $48,108 | $8,712 | $39,396 |
| 2023 | $481 | $45,666 | $7,920 | $37,746 |
| 2022 | $412 | $33,876 | $6,336 | $27,540 |
| 2021 | $413 | $27,150 | $6,336 | $20,814 |
| 2020 | $419 | $24,583 | $4,950 | $19,633 |
| 2019 | $412 | $23,424 | $4,950 | $18,474 |
| 2018 | $392 | $22,244 | $4,950 | $17,294 |
| 2017 | $379 | $21,547 | $4,950 | $16,597 |
| 2016 | $378 | $21,396 | $4,920 | $16,476 |
| 2015 | $335 | $21,396 | $4,920 | $16,476 |
| 2014 | $335 | $21,396 | $4,920 | $16,476 |
Source: Public Records
Map
Nearby Homes
- 316 S McLin St SW
- 106 E 14th St SW
- 1901 Hull Ave SW
- 000 E Oglethorpe Hwy
- 39 E 16th St SW
- 304 E 19th St SW
- 13 N Blanche Ave SW
- 5 Jervis St SW
- 4 E 15th St SW
- 2014 Maple Ave SW
- 1705 Olmstead St SW
- 2 E 10th St SW
- 164 E 11th St SE
- 168 E 11th St SE
- 166 E 11th St SW
- 170 E 11th St SW
- 11 Blacks Bluff Rd SW
- 162 E 11th St SE
- 16 Crescent Ave SW
- 0 Crescent Ave SW Unit 7434840
- 0 Crescent Ave SW Unit 7353154
- 0 Crescent Ave SW Unit 8743901
- 0 Crescent Ave SW Unit 8662385
- 0 Crescent Ave SW Unit 8214187
- 0 Crescent Ave SW Unit 8863786
- 0 Crescent Ave SW Unit 7443346
- 0 Crescent Ave SW Unit 7135873
- 14 Crescent Ave SW
- 24 Crescent Ave SW
- 24 Crescent Ave SW
- 12 Crescent Ave SW
- 13 Crescent Ave SW
- 10 Crescent Ave SW
- 26 Crescent Ave SW
- 9 Crescent Ave SW
- 9 Crescent Ave SW
- 2 Hopewell St SW
- 8 Crescent Ave SW