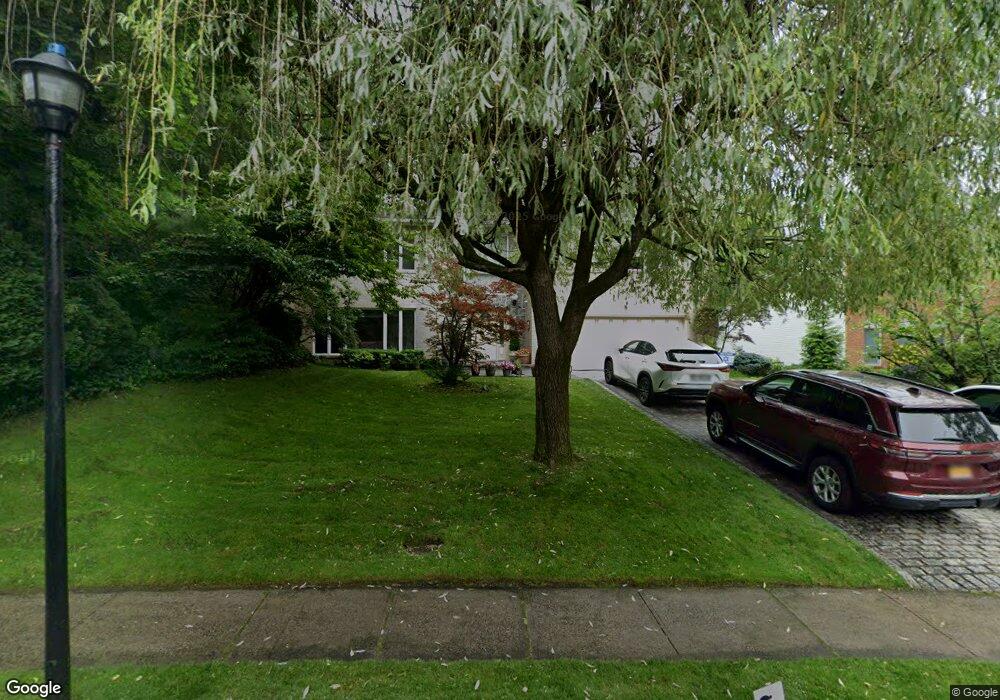
20 Crescent Rd Great Neck, NY 11021
Estimated Value: $1,763,000 - $2,014,414
Studio
4
Baths
3,352
Sq Ft
$563/Sq Ft
Est. Value
About This Home
This home is located at 20 Crescent Rd, Great Neck, NY 11021 and is currently estimated at $1,888,707, approximately $563 per square foot. 20 Crescent Rd is a home located in Nassau County with nearby schools including Elizabeth M. Baker Elementary School, Great Neck South Middle School, and Great Neck North Middle School.
Create a Home Valuation Report for This Property
The Home Valuation Report is an in-depth analysis detailing your home's value as well as a comparison with similar homes in the area
Home Values in the Area
Average Home Value in this Area
Tax History
| Year | Tax Paid | Tax Assessment Tax Assessment Total Assessment is a certain percentage of the fair market value that is determined by local assessors to be the total taxable value of land and additions on the property. | Land | Improvement |
|---|---|---|---|---|
| 2025 | $31,499 | $1,618 | $626 | $992 |
| 2024 | $9,116 | $1,618 | $626 | $992 |
Source: Public Records
Map
Nearby Homes
- 3 N Avalon Rd
- 11 Arbor St
- 7 Terrace Dr Unit 3H
- 185 S Middle Neck Rd Unit 1-P
- 185 S Middle Neck Rd Unit 1G
- 90 Schenck Ave Unit 3P
- 90 Schenck Ave Unit 2L
- 195 S Middle Neck Rd Unit 2-L
- 195 S Middle Neck Rd Unit 2 H
- 45 Hill Park Ave Unit Pr2
- 45 Hill Park Ave Unit 2L
- 88 Manor Dr
- 48 Nassau Dr
- 180 S Middle Neck Rd Unit 1-Q
- 200 S Middle Neck Rd Unit J-6
- 200 S Middle Neck Rd Unit F6
- 20 Gilchrest Rd Unit 3D
- 8 Welwyn Rd Unit 3F
- 15 Hill Park Ave Unit 1-L
- 15 Hill Park Ave Unit 1C
- 22 Crescent Rd
- 18 Crescent Rd
- 9 Highland Ave
- 11 Highland Ave
- 7 Highland Ave
- 21 Crescent Rd
- 19 Crescent Rd
- 16 Crescent Rd
- 23 Crescent Rd
- 216 Shoreward Dr
- 25 Crescent Rd
- 5 Highland Ave
- 12 Lincoln Rd
- 16 Lincoln Rd
- 218 Shoreward Dr
- 14 Crescent Rd
- 20 Lincoln Rd
- 6 Highland Ave
- 4 Highland Ave
- 8 Highland Ave
Your Personal Tour Guide
Ask me questions while you tour the home.