Estimated Value: $332,153 - $421,000
Studio
1
Bath
2,578
Sq Ft
$148/Sq Ft
Est. Value
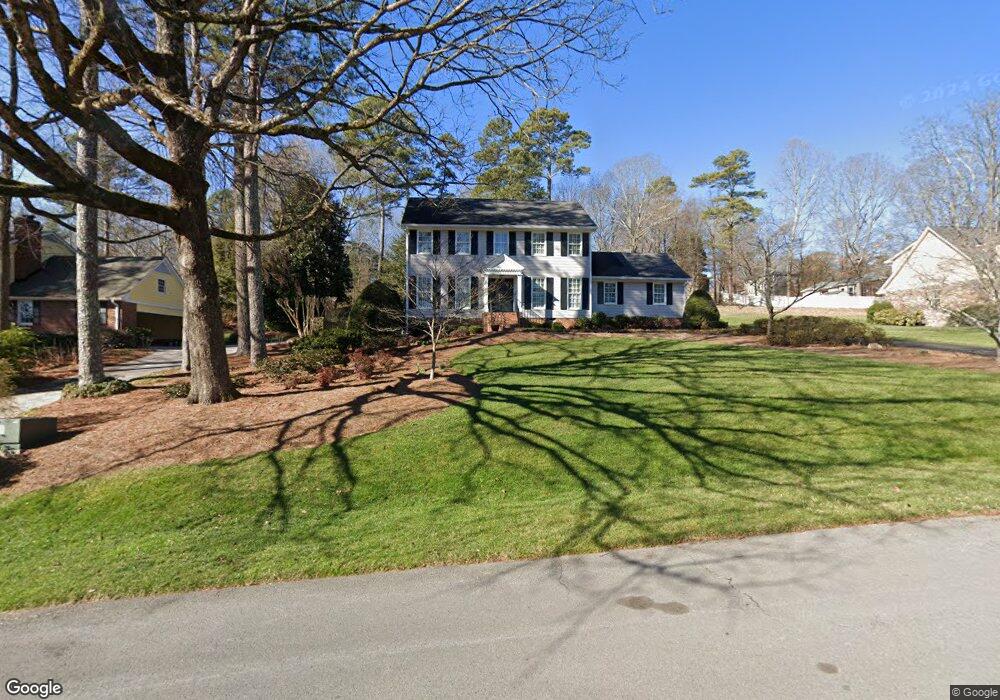
About This Home
This home is located at 20 Cumberland Dr SE, Rome, GA 30161 and is currently estimated at $382,038, approximately $148 per square foot. 20 Cumberland Dr SE is a home located in Floyd County with nearby schools including Rome High School, Montessori School of Rome, and St. Mary School.
Ownership History
Date
Name
Owned For
Owner Type
Purchase Details
Closed on
Jan 30, 1992
Sold by
Santoro James J and Lenora Sinca Santor
Bought by
Cooper Gayland W
Current Estimated Value
Purchase Details
Closed on
Jun 28, 1984
Sold by
Kosboth David L and Kosboth Sharon D
Bought by
Santoro James J and Lenora Sinca S
Purchase Details
Closed on
Aug 11, 1978
Sold by
Likes Creighton E
Bought by
Kosboth David L and Kosboth Sharon D
Purchase Details
Closed on
Feb 17, 1977
Sold by
Weinrauch Weinrauch J and Weinrauch Rosemary
Bought by
Likes Creighton E
Purchase Details
Closed on
Aug 18, 1976
Sold by
Toles & Temple & Wright Inc
Bought by
Weinrauch Weinrauch J and Weinrauch Rosemary
Purchase Details
Closed on
Apr 21, 1974
Bought by
P and R
Purchase Details
Closed on
Apr 20, 1974
Bought by
P and R
Purchase Details
Closed on
Apr 19, 1974
Bought by
Toles & Temple & Wright Inc
Purchase Details
Closed on
Apr 1, 1974
Bought by
P and R
Create a Home Valuation Report for This Property
The Home Valuation Report is an in-depth analysis detailing your home's value as well as a comparison with similar homes in the area
Home Values in the Area
Average Home Value in this Area
Purchase History
| Date | Buyer | Sale Price | Title Company |
|---|---|---|---|
| Cooper Gayland W | $123,500 | -- | |
| Santoro James J | $90,000 | -- | |
| Kosboth David L | $65,300 | -- | |
| Likes Creighton E | $57,000 | -- | |
| Weinrauch Weinrauch J | $53,500 | -- | |
| P | -- | -- | |
| P | -- | -- | |
| Toles & Temple & Wright Inc | -- | -- | |
| P | -- | -- |
Source: Public Records
Tax History
| Year | Tax Paid | Tax Assessment Tax Assessment Total Assessment is a certain percentage of the fair market value that is determined by local assessors to be the total taxable value of land and additions on the property. | Land | Improvement |
|---|---|---|---|---|
| 2025 | $3,497 | $139,544 | $8,904 | $130,640 |
| 2024 | $3,497 | $131,512 | $8,400 | $123,112 |
| 2023 | $3,475 | $128,720 | $8,400 | $120,320 |
| 2022 | $3,204 | $109,709 | $8,000 | $101,709 |
| 2021 | $2,925 | $90,864 | $8,000 | $82,864 |
| 2020 | $2,728 | $78,371 | $8,000 | $70,371 |
| 2019 | $2,648 | $75,270 | $8,000 | $67,270 |
| 2018 | $2,591 | $72,019 | $8,000 | $64,019 |
| 2017 | $2,500 | $68,794 | $8,000 | $60,794 |
| 2016 | $2,477 | $68,000 | $8,000 | $60,000 |
| 2015 | -- | $67,099 | $8,000 | $59,099 |
| 2014 | -- | $67,099 | $8,000 | $59,099 |
Source: Public Records
Map
Nearby Homes
- 11 Cumberland Dr SE
- 30 Coventry Dr SE
- 20 Coventry Dr SE
- 22 Coventry Dr SE
- 31 Coventry Dr SE
- 0 Twickenham Rd SE Unit 10707322
- 0 Twickenham Rd SE Unit 7732642
- 18 Wellington Way SE
- 36 Coventry Dr SE
- 9 Wellington Way SE
- 14 Saddlebrook Dr SE
- 26 Saddlebrook Dr SE
- 15 Saddlebrook Dr SE
- 2405 Rockmart Rd SE
- 0 Highway 411 SE Unit 7692418
- 0 Highway 411 SE Unit 10657682
- 2107 Rockmart Rd SE
- 11 Cambridge Dr SE
- 27 Saddle Mountain Rd SE
- 0 Wellington Way SE Unit 10693561
- 0 Cumberland Dr SE Unit 10167085
- 0 Cumberland Dr SE Unit 7226712
- 0 Cumberland Dr SE Unit 7110093
- 0 Cumberland Dr SE Unit 20071095
- 0 Cumberland Dr SE Unit 8847612
- 0 Cumberland Dr SE
- 18 Cumberland Dr SE
- 22 Cumberland Dr SE
- 7 Turner Springs Dr SE
- 5 Turner Springs Dr SE Unit 16
- 5 Turner Springs Dr SE
- 21 Cumberland Dr SE
- 16 Cumberland Dr SE
- 24 Cumberland Dr SE
- 3 Coventry Dr SE
- 8 Turner Springs Dr SE
- 3 Turner Springs Dr SE
- 23 Cumberland Dr SE
- 9 Cumberland Dr SE
- 5 Coventry Dr SE Unit 12
Your Personal Tour Guide
Ask me questions while you tour the home.