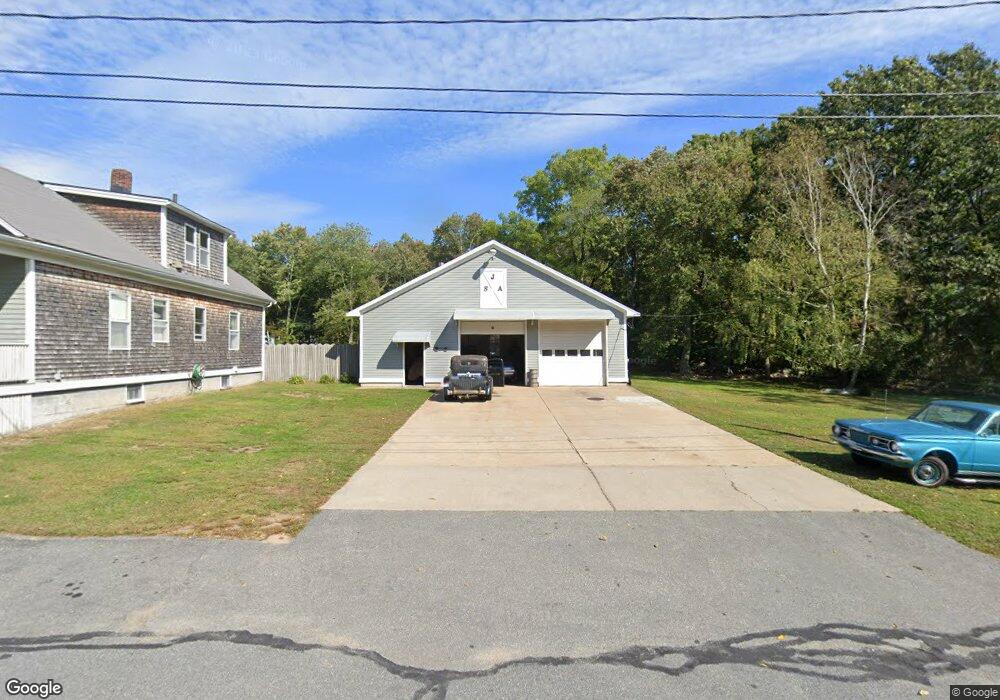
20 Dalton St Acushnet, MA 02743
Estimated Value: $411,000 - $468,000
2
Beds
1
Bath
1,693
Sq Ft
$262/Sq Ft
Est. Value
About This Home
This home is located at 20 Dalton St, Acushnet, MA 02743 and is currently estimated at $443,676, approximately $262 per square foot. 20 Dalton St is a home located in Bristol County with nearby schools including Acushnet Elementary School, Albert F Ford Middle School, and Alma Del Mar Charter School.
Ownership History
Date
Name
Owned For
Owner Type
Purchase Details
Closed on
Mar 7, 2025
Sold by
Souliere James Est and Breton
Bought by
Breton Renee
Current Estimated Value
Purchase Details
Closed on
Oct 12, 2010
Sold by
Souliere James and Souliere Jayne A
Bought by
Souliere James
Purchase Details
Closed on
Aug 10, 1987
Sold by
Mondow Eugene
Bought by
Talbot Jayne A
Create a Home Valuation Report for This Property
The Home Valuation Report is an in-depth analysis detailing your home's value as well as a comparison with similar homes in the area
Home Values in the Area
Average Home Value in this Area
Purchase History
| Date | Buyer | Sale Price | Title Company |
|---|---|---|---|
| Breton Renee | -- | None Available | |
| Breton Renee | -- | None Available | |
| Breton Renee | -- | None Available | |
| Souliere James | -- | -- | |
| Souliere James | -- | -- | |
| Talbot Jayne A | $96,000 | -- |
Source: Public Records
Mortgage History
| Date | Status | Borrower | Loan Amount |
|---|---|---|---|
| Previous Owner | Talbot Jayne A | $65,000 | |
| Previous Owner | Talbot Jayne A | $35,000 |
Source: Public Records
Tax History Compared to Growth
Tax History
| Year | Tax Paid | Tax Assessment Tax Assessment Total Assessment is a certain percentage of the fair market value that is determined by local assessors to be the total taxable value of land and additions on the property. | Land | Improvement |
|---|---|---|---|---|
| 2025 | $4,340 | $402,200 | $114,200 | $288,000 |
| 2024 | $4,339 | $380,300 | $109,200 | $271,100 |
| 2023 | $4,100 | $341,700 | $99,300 | $242,400 |
| 2022 | $4,217 | $317,800 | $94,300 | $223,500 |
| 2021 | $3,814 | $275,800 | $94,300 | $181,500 |
| 2020 | $3,845 | $275,800 | $94,300 | $181,500 |
| 2019 | $3,666 | $258,500 | $94,300 | $164,200 |
| 2018 | $3,568 | $247,400 | $94,300 | $153,100 |
| 2017 | $3,457 | $239,400 | $94,300 | $145,100 |
| 2016 | $3,303 | $227,300 | $94,300 | $133,000 |
| 2015 | $3,246 | $227,300 | $94,300 | $133,000 |
Source: Public Records
Map
Nearby Homes