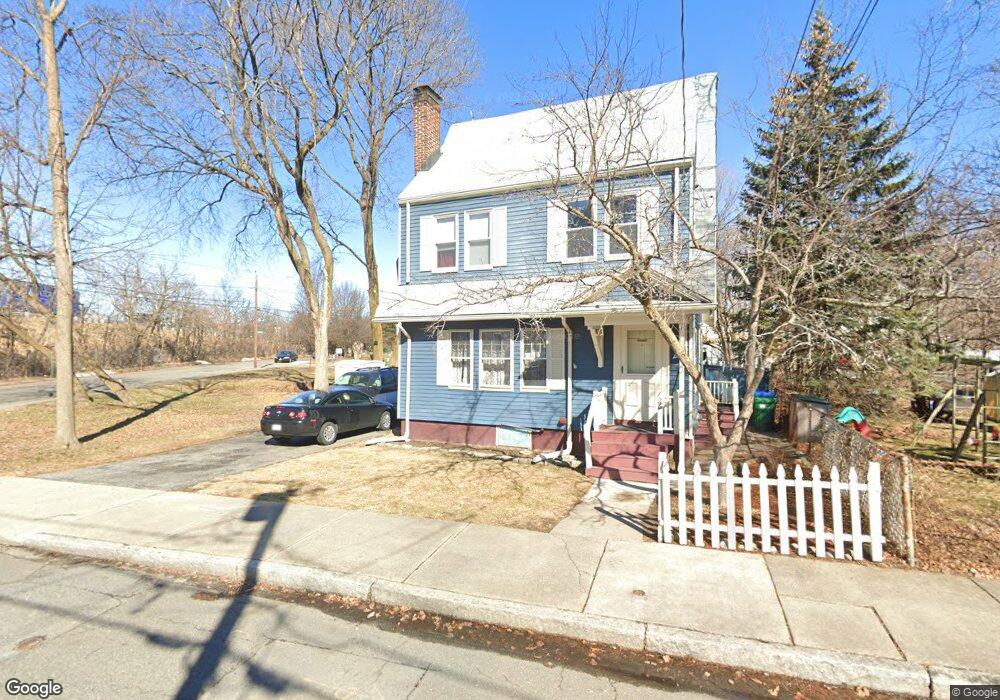
20 Daniels St Medford, MA 02155
Glenwood NeighborhoodEstimated Value: $665,000 - $804,000
3
Beds
2
Baths
1,266
Sq Ft
$593/Sq Ft
Est. Value
About This Home
This home is located at 20 Daniels St, Medford, MA 02155 and is currently estimated at $751,134, approximately $593 per square foot. 20 Daniels St is a home located in Middlesex County with nearby schools including Medford High School, Mystic Valley Regional Charter School, and St. Joseph School.
Ownership History
Date
Name
Owned For
Owner Type
Purchase Details
Closed on
Nov 8, 2021
Sold by
Stone Gables Condo Assn
Bought by
Cain Matthew D and Ellis Brittany
Current Estimated Value
Purchase Details
Closed on
Jul 21, 2021
Sold by
Perry Christopher M and Perry Patricia A
Bought by
Li Jing
Purchase Details
Closed on
Dec 16, 2004
Sold by
Asn Multifamily Lp
Bought by
Cig Charles Daniels Ll
Home Financials for this Owner
Home Financials are based on the most recent Mortgage that was taken out on this home.
Original Mortgage
$9,999,999
Interest Rate
5.68%
Mortgage Type
Purchase Money Mortgage
Purchase Details
Closed on
Dec 6, 2004
Sold by
Decicco Beth M and Hagen Beth M
Bought by
Decicco Beth M and Hagen Beth M
Home Financials for this Owner
Home Financials are based on the most recent Mortgage that was taken out on this home.
Original Mortgage
$9,999,999
Interest Rate
5.68%
Mortgage Type
Purchase Money Mortgage
Purchase Details
Closed on
Oct 10, 2003
Sold by
Asn Charles Daniels Ll
Bought by
Asn Multifamily P
Create a Home Valuation Report for This Property
The Home Valuation Report is an in-depth analysis detailing your home's value as well as a comparison with similar homes in the area
Home Values in the Area
Average Home Value in this Area
Purchase History
| Date | Buyer | Sale Price | Title Company |
|---|---|---|---|
| Cain Matthew D | $7,600 | None Available | |
| Li Jing | -- | None Available | |
| Cig Charles Daniels Ll | $17,750,000 | -- | |
| Decicco Beth M | $375,000 | -- | |
| Asn Multifamily P | -- | -- |
Source: Public Records
Mortgage History
| Date | Status | Borrower | Loan Amount |
|---|---|---|---|
| Previous Owner | Cig Charles Daniels Ll | $9,999,999 | |
| Previous Owner | Decicco Beth M | $247,000 |
Source: Public Records
Tax History Compared to Growth
Tax History
| Year | Tax Paid | Tax Assessment Tax Assessment Total Assessment is a certain percentage of the fair market value that is determined by local assessors to be the total taxable value of land and additions on the property. | Land | Improvement |
|---|---|---|---|---|
| 2025 | $5,289 | $601,000 | $317,800 | $283,200 |
| 2024 | $4,931 | $578,700 | $302,600 | $276,100 |
| 2023 | $4,746 | $548,700 | $282,800 | $265,900 |
| 2022 | $4,427 | $491,300 | $257,100 | $234,200 |
| 2021 | $4,403 | $467,900 | $244,900 | $223,000 |
| 2020 | $4,333 | $472,000 | $244,900 | $227,100 |
| 2019 | $4,170 | $434,400 | $222,600 | $211,800 |
| 2018 | $3,928 | $383,600 | $202,400 | $181,200 |
| 2017 | $3,730 | $353,200 | $189,100 | $164,100 |
| 2016 | $3,397 | $303,600 | $172,000 | $131,600 |
| 2015 | $3,352 | $286,500 | $163,800 | $122,700 |
Source: Public Records
Map
Nearby Homes
- 3 Pleasant St Unit 1
- 240 Salem St Unit 3C
- 20 Ship Ave Unit 8
- 179 Park St Unit 201
- 5 Ash St Unit 9
- 54 Forest St Unit 411
- 54 Forest St Unit 322
- 48 Forest St Unit 201
- 14 Tainter St Unit 2
- 38 Tainter St
- 18 Sheridan Ave
- 52 Woodrow Ave Unit 1
- 10 Lewis St
- 10 Lewis St Unit 2
- 10 Lewis St Unit 1
- 54 Woodrow Ave Unit 2
- 70 Tainter St
- 70 Tainter St Unit 1
- 19 Paris St Unit 302
- 53 Sheridan Ave
- 30 Daniels St
- 19 Daniels St
- 15 Daniels St
- 15 Daniels St Unit 3
- 15 Daniels St Unit 2
- 25 Daniels St
- 29 Daniels St
- 36 Daniels St Unit 1
- 36 Daniels St Unit 2
- 36 Daniels St Unit 36
- 36 Daniels St
- 34 Daniels St
- 1a Lauriat Place Unit 2
- 5 Lauriat Place
- 3 Lauriat Place Unit A
- 3 Lauriat Place
- 1 Lauriat Place Unit A
- 1 Lauriat Place
- 3A Lauriat Place Unit A
- 1 Lauriat Place Unit 1