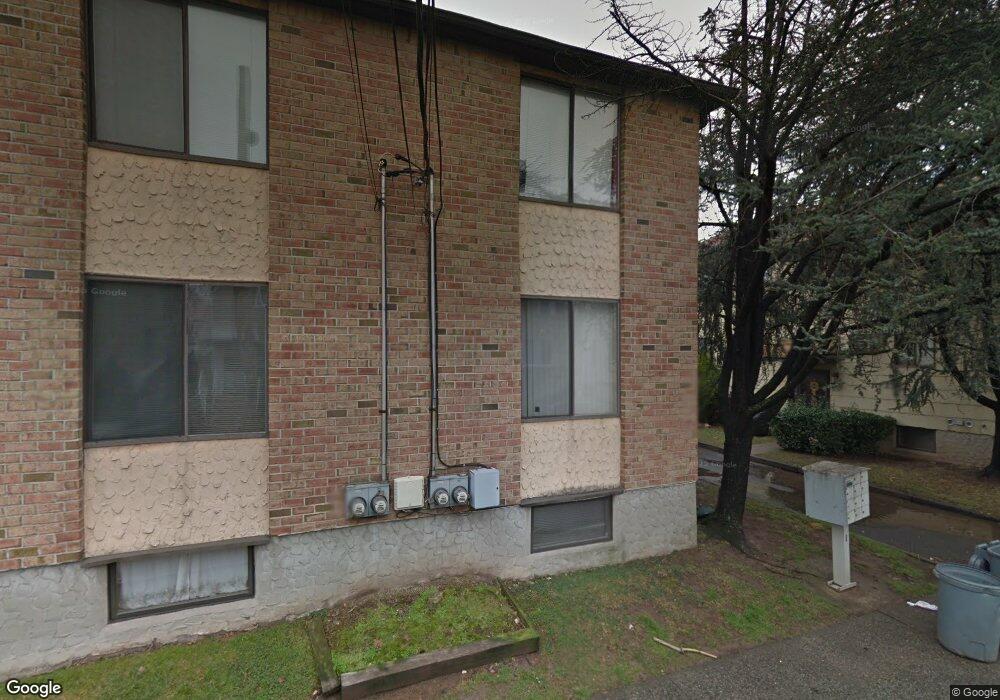
20 Davis Ct Unit 1G Staten Island, NY 10310
Randall Manor NeighborhoodEstimated Value: $378,000 - $404,932
--
Bed
--
Bath
743
Sq Ft
$526/Sq Ft
Est. Value
About This Home
This home is located at 20 Davis Ct Unit 1G, Staten Island, NY 10310 and is currently estimated at $390,983, approximately $526 per square foot. 20 Davis Ct Unit 1G is a home located in Richmond County with nearby schools including P.S. 18 John G. Whittier, Is 61 William A Morris, and Curtis High School.
Ownership History
Date
Name
Owned For
Owner Type
Purchase Details
Closed on
Feb 22, 2024
Sold by
Christiana Trust and Resid Cr Opportunities Trust
Bought by
Chai Yuk Shing
Current Estimated Value
Home Financials for this Owner
Home Financials are based on the most recent Mortgage that was taken out on this home.
Original Mortgage
$279,920
Interest Rate
6.64%
Mortgage Type
New Conventional
Purchase Details
Closed on
Jan 11, 2018
Sold by
Albunio Vincent A
Bought by
Wilmington Savings Fund Society and Residential Credit Opportunities Trust
Purchase Details
Closed on
Jan 16, 2004
Sold by
Paradise Kenneth and Paradise Joann
Bought by
Brady Sarah
Home Financials for this Owner
Home Financials are based on the most recent Mortgage that was taken out on this home.
Original Mortgage
$129,780
Interest Rate
6.5%
Mortgage Type
Purchase Money Mortgage
Create a Home Valuation Report for This Property
The Home Valuation Report is an in-depth analysis detailing your home's value as well as a comparison with similar homes in the area
Home Values in the Area
Average Home Value in this Area
Purchase History
| Date | Buyer | Sale Price | Title Company |
|---|---|---|---|
| Chai Yuk Shing | $349,900 | None Listed On Document | |
| Wilmington Savings Fund Society | $281,545 | None Available | |
| Brady Sarah | $144,200 | Newell & Talarico Title Agen |
Source: Public Records
Mortgage History
| Date | Status | Borrower | Loan Amount |
|---|---|---|---|
| Previous Owner | Chai Yuk Shing | $279,920 | |
| Previous Owner | Brady Sarah | $129,780 |
Source: Public Records
Tax History Compared to Growth
Tax History
| Year | Tax Paid | Tax Assessment Tax Assessment Total Assessment is a certain percentage of the fair market value that is determined by local assessors to be the total taxable value of land and additions on the property. | Land | Improvement |
|---|---|---|---|---|
| 2025 | $2,046 | $16,223 | $1,787 | $14,436 |
| 2024 | $2,046 | $14,400 | $1,900 | $12,500 |
| 2023 | $1,952 | $9,612 | $1,925 | $7,687 |
| 2022 | $1,810 | $11,940 | $2,685 | $9,255 |
| 2021 | $1,908 | $10,943 | $2,685 | $8,258 |
| 2020 | $2,357 | $12,420 | $2,685 | $9,735 |
| 2019 | $2,206 | $11,077 | $2,685 | $8,392 |
| 2018 | $1,633 | $8,010 | $2,621 | $5,389 |
| 2017 | $1,540 | $7,557 | $2,685 | $4,872 |
| 2016 | $1,581 | $7,910 | $2,685 | $5,225 |
| 2015 | $1,688 | $8,198 | $2,685 | $5,513 |
| 2014 | $1,688 | $8,798 | $2,685 | $6,113 |
Source: Public Records
Map
Nearby Homes
- 16 Howard Ct
- 154 Bard Ave Unit 14A
- 21 Elizabeth Ave
- 144 Bard Ave Unit 25b
- 154 Pelton Ave
- 160 Bard Ave Unit 6A
- 188 Davis Ave
- 163 Bement Ave
- 70 Elm St
- 11 Curtis Ct
- 84 Elm St
- 110 Kissel Ave
- 699 Henderson Ave
- 698 Henderson Ave
- 207 N Burgher Ave
- 718 Henderson Ave
- 4 Brentwood Ave
- 44 Westbury Ave
- 943 Castleton Ave
- 331 Oakland Ave
- 28 Davis Ct Unit 28
- 26 Davis Ct
- 14 Davis Ct Unit 1A
- 20 Davis Ct Unit 121
- 16 Davis Ct Unit 1D
- 18 Davis Ct Unit 1F
- 24 Davis Ct Unit 1M
- 22 Davis Ct Unit 1H
- 114 Davis Ave
- 7 Davis Ct
- 9 Davis Ct
- 118 Davis Ave
- 87 Pelton Ave
- 91 Pelton Ave
- 11 Davis Ct
- 83 Pelton Ave
- 3 Davis Ct
- 79 Pelton Ave
- 99 Pelton Ave
- 100 Davis Ave