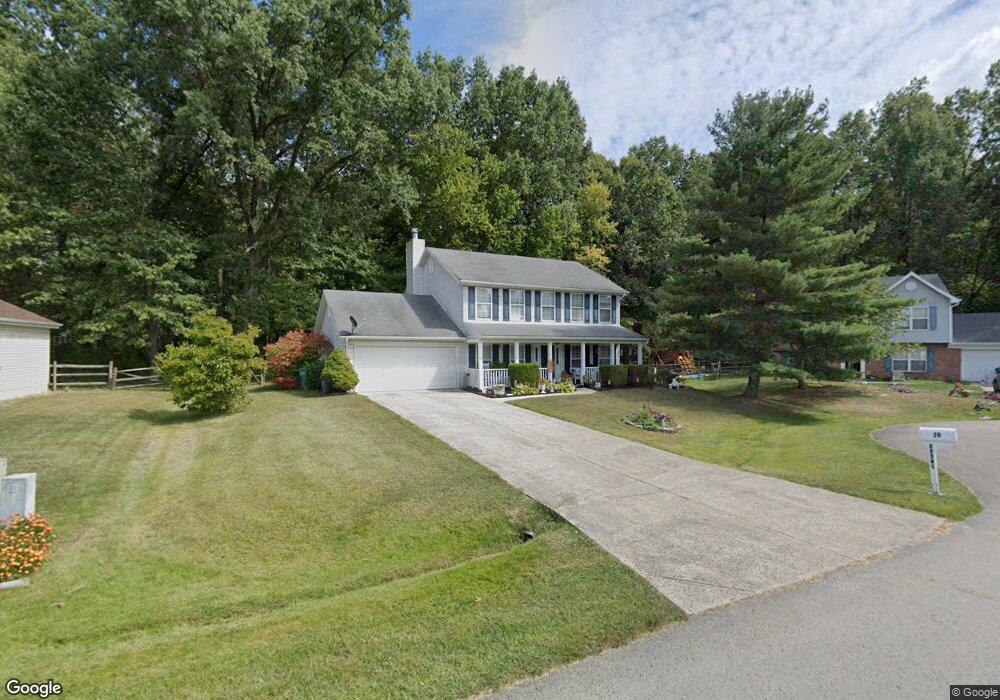
20 Depot Cir Georgetown, OH 45121
Estimated Value: $274,094 - $336,000
3
Beds
3
Baths
1,920
Sq Ft
$158/Sq Ft
Est. Value
About This Home
This home is located at 20 Depot Cir, Georgetown, OH 45121 and is currently estimated at $302,774, approximately $157 per square foot. 20 Depot Cir is a home located in Brown County with nearby schools including Georgetown Elementary School and Georgetown Jr/Sr High School.
Ownership History
Date
Name
Owned For
Owner Type
Purchase Details
Closed on
May 1, 2000
Sold by
Cunningham James T
Bought by
Boone Douglas M and Boone Regina
Current Estimated Value
Home Financials for this Owner
Home Financials are based on the most recent Mortgage that was taken out on this home.
Original Mortgage
$132,870
Outstanding Balance
$43,486
Interest Rate
8.24%
Mortgage Type
VA
Estimated Equity
$259,288
Purchase Details
Closed on
Mar 5, 1998
Sold by
Feldkamp John R
Bought by
Cunningham James T
Home Financials for this Owner
Home Financials are based on the most recent Mortgage that was taken out on this home.
Original Mortgage
$90,000
Interest Rate
7.08%
Mortgage Type
New Conventional
Purchase Details
Closed on
Apr 19, 1996
Sold by
Schweiger Homes Inc
Bought by
Feldkamp John R and Feldkamp Melissa K
Home Financials for this Owner
Home Financials are based on the most recent Mortgage that was taken out on this home.
Original Mortgage
$116,218
Interest Rate
8.25%
Mortgage Type
VA
Create a Home Valuation Report for This Property
The Home Valuation Report is an in-depth analysis detailing your home's value as well as a comparison with similar homes in the area
Home Values in the Area
Average Home Value in this Area
Purchase History
| Date | Buyer | Sale Price | Title Company |
|---|---|---|---|
| Boone Douglas M | $129,000 | -- | |
| Cunningham James T | $113,500 | -- | |
| Feldkamp John R | $113,940 | -- |
Source: Public Records
Mortgage History
| Date | Status | Borrower | Loan Amount |
|---|---|---|---|
| Open | Boone Douglas M | $132,870 | |
| Previous Owner | Cunningham James T | $90,000 | |
| Previous Owner | Feldkamp John R | $116,218 |
Source: Public Records
Tax History
| Year | Tax Paid | Tax Assessment Tax Assessment Total Assessment is a certain percentage of the fair market value that is determined by local assessors to be the total taxable value of land and additions on the property. | Land | Improvement |
|---|---|---|---|---|
| 2024 | $2,266 | $74,150 | $7,280 | $66,870 |
| 2023 | $2,280 | $58,440 | $6,300 | $52,140 |
| 2022 | $1,916 | $58,440 | $6,300 | $52,140 |
| 2021 | $1,899 | $58,440 | $6,300 | $52,140 |
| 2020 | $1,621 | $48,700 | $5,250 | $43,450 |
| 2019 | $1,610 | $48,700 | $5,250 | $43,450 |
| 2018 | $1,598 | $48,700 | $5,250 | $43,450 |
| 2017 | $1,171 | $43,510 | $5,780 | $37,730 |
| 2016 | $1,171 | $43,510 | $5,780 | $37,730 |
| 2015 | $1,217 | $43,510 | $5,780 | $37,730 |
| 2014 | $1,217 | $42,980 | $5,250 | $37,730 |
| 2013 | $1,214 | $42,980 | $5,250 | $37,730 |
Source: Public Records
Map
Nearby Homes
- 2 N Kenwood Ave
- 1 N Kenwood Ave
- 427 Kenwood Ave
- 508 Mount Orab Pike
- 399 Elmwood Ct
- 60 New St
- 406 E North St
- 405 N Main St
- 666 E State St
- 708 E State St
- 505 S Water St
- 510 W State St
- 25 Douglas Ln
- 4279 Sunshine Rd
- 155 Free Soil Rd
- 0 St Rt 221 & Footbridge Unit 1826509
- 175 Douglas Cir
- 9995 U S 68
- 0 Barnes Rd Unit 1851215
- 3486 Barnes Rd
Your Personal Tour Guide
Ask me questions while you tour the home.