G
Seller's Agent in 2014
Gail Petersen Bell
Compass


Estimated Value: $1,084,000 - $1,345,218
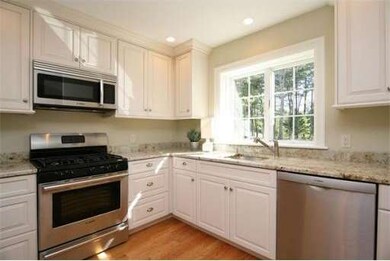
Only 3 units left! A winding 600 foot road over a stone bridge welcomes you to your home situated on 8.53 gorgeous wooded private acres. This is an End unit offerering 3 bedrooms, 2 5 Baths and a 2 car attached garage. First floor master w/vaulted ceiling, custom kitchen cabinets, Bosch stainless & granite. Cathedral LR w/gas FP, custom trim. There are 2 bedrooms, full bath w/loft on the 2nd level. Hardwood, tile baths. Eco landscaping. Convenient to Rt 3 & Derby St Shoppes! Units 19 and 20 will have walk out basements!
Last Agent to Sell the Property
Gail Petersen Bell
Compass Listed on: 05/31/2013

Home Type
Condominium
Year Built
2013
Lot Details
8.53 Acres
| Date | Buyer | Sale Price | Title Company |
|---|---|---|---|
| Fisher Ft | -- | -- | |
| Fisher Michael | $846,000 | -- |
| Date | Status | Borrower | Loan Amount |
|---|---|---|---|
| Previous Owner | Fisher Michael | $676,800 |
| Date | Event | Price | List to Sale | Price per Sq Ft |
|---|---|---|---|---|
| 07/02/2014 07/02/14 | Sold | $846,000 | 0.0% | $405 / Sq Ft |
| 05/06/2014 05/06/14 | Pending | -- | -- | -- |
| 04/11/2014 04/11/14 | Off Market | $846,000 | -- | -- |
| 02/04/2014 02/04/14 | For Sale | $789,000 | -6.7% | $378 / Sq Ft |
| 01/27/2014 01/27/14 | Off Market | $846,000 | -- | -- |
| 05/31/2013 05/31/13 | For Sale | $789,000 | -- | $378 / Sq Ft |
| Year | Tax Paid | Tax Assessment Tax Assessment Total Assessment is a certain percentage of the fair market value that is determined by local assessors to be the total taxable value of land and additions on the property. | Land | Improvement |
|---|---|---|---|---|
| 2025 | $11,461 | $1,072,100 | $0 | $1,072,100 |
| 2024 | $11,632 | $1,072,100 | $0 | $1,072,100 |
| 2023 | $8,999 | $899,900 | $0 | $899,900 |
| 2022 | $9,435 | $816,200 | $0 | $816,200 |
| 2021 | $9,714 | $823,200 | $0 | $823,200 |
| 2020 | $9,880 | $856,900 | $0 | $856,900 |
| 2019 | $11,469 | $971,100 | $0 | $971,100 |
| 2018 | $10,182 | $865,100 | $0 | $865,100 |
| 2017 | $9,785 | $798,800 | $0 | $798,800 |
| 2016 | $9,852 | $788,800 | $0 | $788,800 |
| 2015 | $155 | $12,400 | $0 | $12,400 |
G
Seller's Agent in 2014
Gail Petersen Bell
Compass
Buyer's Agent in 2014
Dottie Gay
Coldwell Banker Realty - Plymouth
(781) 291-9396
26 Total Sales
Source: MLS Property Information Network (MLS PIN)
MLS Number: 71534578
APN: HING-000187-000120-000011
Disclaimer: Certain information contained herein is derived from information provided by parties other than Homes.com. All information provided is deemed reliable, but is not guaranteed to be accurate and should be independently verified.
![]() The property listing data and information, or the Images, set forth herein were provided to MLS Property Information Network, Inc. from third party sources, including sellers, lessors and public records, and were compiled by MLS Property Information Network, Inc. The property listing data and information, and the Images, are for the personal, non-commercial use of consumers having a good faith interest in purchasing or leasing listed properties of the type displayed to them and may not be used for any purpose other than to identify prospective properties which such consumers may have a good faith interest in purchasing or leasing. MLS Property Information Network, Inc. and its subscribers disclaim any and all representations and warranties as to the accuracy of the property listing data and information, or as to the accuracy of any of the Images, set forth herein.
The property listing data and information, or the Images, set forth herein were provided to MLS Property Information Network, Inc. from third party sources, including sellers, lessors and public records, and were compiled by MLS Property Information Network, Inc. The property listing data and information, and the Images, are for the personal, non-commercial use of consumers having a good faith interest in purchasing or leasing listed properties of the type displayed to them and may not be used for any purpose other than to identify prospective properties which such consumers may have a good faith interest in purchasing or leasing. MLS Property Information Network, Inc. and its subscribers disclaim any and all representations and warranties as to the accuracy of the property listing data and information, or as to the accuracy of any of the Images, set forth herein.
Ask me questions while you tour the home.