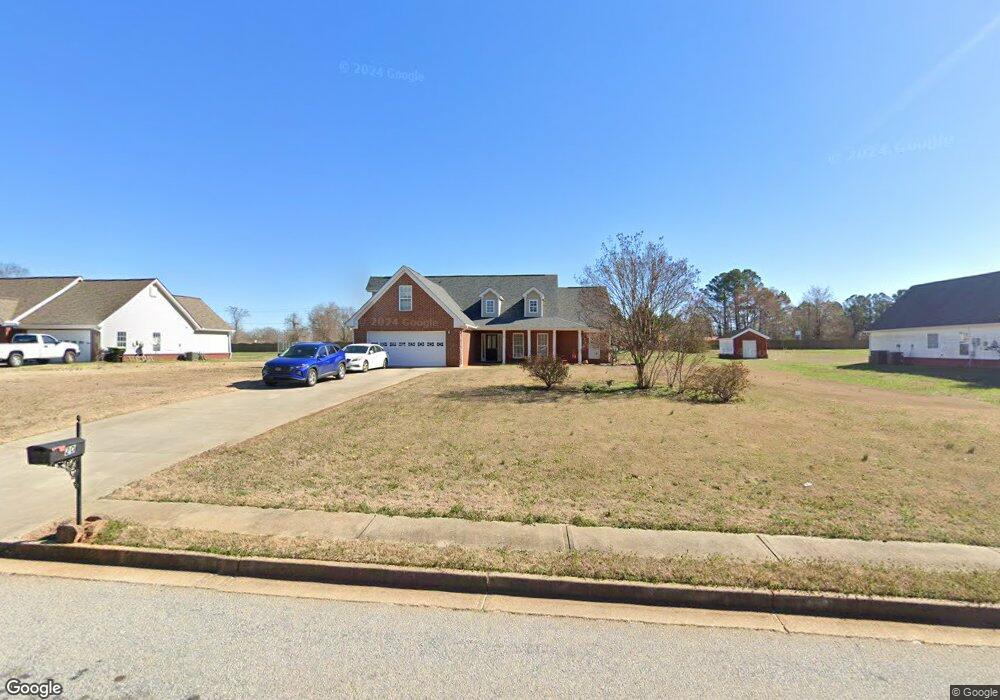
20 Derby Ct Covington, GA 30016
Estimated Value: $345,349 - $352,000
3
Beds
2
Baths
2,388
Sq Ft
$146/Sq Ft
Est. Value
About This Home
This home is located at 20 Derby Ct, Covington, GA 30016 and is currently estimated at $348,587, approximately $145 per square foot. 20 Derby Ct is a home located in Newton County with nearby schools including Heard-Mixon Elementary School, Indian Creek Middle School, and Alcovy High School.
Ownership History
Date
Name
Owned For
Owner Type
Purchase Details
Closed on
Sep 8, 2016
Sold by
Lowry Michael L and Lowry Jennifer K
Bought by
Hawk Timothy H and Hawk Kathy
Current Estimated Value
Home Financials for this Owner
Home Financials are based on the most recent Mortgage that was taken out on this home.
Original Mortgage
$187,000
Outstanding Balance
$149,464
Interest Rate
3.45%
Mortgage Type
VA
Estimated Equity
$199,123
Purchase Details
Closed on
Apr 10, 2003
Sold by
Top Notch Hms Inc
Bought by
Lowry Michael L and Lowry Jennifer
Home Financials for this Owner
Home Financials are based on the most recent Mortgage that was taken out on this home.
Original Mortgage
$162,103
Interest Rate
5.62%
Mortgage Type
FHA
Purchase Details
Closed on
May 10, 2002
Sold by
Homes Decks & Docks
Bought by
Yop Notch Homes
Home Financials for this Owner
Home Financials are based on the most recent Mortgage that was taken out on this home.
Original Mortgage
$248,900
Interest Rate
7.18%
Mortgage Type
New Conventional
Create a Home Valuation Report for This Property
The Home Valuation Report is an in-depth analysis detailing your home's value as well as a comparison with similar homes in the area
Home Values in the Area
Average Home Value in this Area
Purchase History
| Date | Buyer | Sale Price | Title Company |
|---|---|---|---|
| Hawk Timothy H | $187,000 | -- | |
| Lowry Michael L | $163,400 | -- | |
| Yop Notch Homes | $58,000 | -- |
Source: Public Records
Mortgage History
| Date | Status | Borrower | Loan Amount |
|---|---|---|---|
| Open | Hawk Timothy H | $187,000 | |
| Previous Owner | Lowry Michael L | $162,103 | |
| Previous Owner | Yop Notch Homes | $248,900 |
Source: Public Records
Tax History Compared to Growth
Tax History
| Year | Tax Paid | Tax Assessment Tax Assessment Total Assessment is a certain percentage of the fair market value that is determined by local assessors to be the total taxable value of land and additions on the property. | Land | Improvement |
|---|---|---|---|---|
| 2024 | $3,152 | $125,960 | $17,600 | $108,360 |
| 2023 | $3,362 | $125,600 | $6,200 | $119,400 |
| 2022 | $2,893 | $108,320 | $6,200 | $102,120 |
| 2021 | $2,619 | $88,320 | $6,200 | $82,120 |
| 2020 | $2,712 | $82,920 | $6,200 | $76,720 |
| 2019 | $2,384 | $72,120 | $6,200 | $65,920 |
| 2018 | $2,388 | $71,800 | $6,200 | $65,600 |
| 2017 | $2,398 | $72,080 | $6,200 | $65,880 |
| 2016 | $2,109 | $59,760 | $4,000 | $55,760 |
| 2015 | $1,861 | $52,560 | $4,000 | $48,560 |
| 2014 | $1,286 | $35,960 | $0 | $0 |
Source: Public Records
Map
Nearby Homes
- 115 Willow Springs Dr
- 10 Stewart Hollow Ln
- 20 Hollow Ct
- 80 Stewart Hollow Ln
- 0 Newton Factory Bridge Rd Unit 10615368
- 0 Newton Factory Bridge Rd Unit 7657995
- 940 Newton Factory Bridge Rd
- 497 Highway 212
- 686 Newton Factory Bridge Rd
- 10 Windbrooke Dr
- 175 Pine Ridge Rd
- 1503 McDonald Rd
- 205 Pebble Creek Dr
- 933 Fincher Rd
- 50 Bates Rd
- 718 Fincher Rd
- 867 Bear Creek Point
- 734 Fincher Rd
- 10 Derby Ct
- 30 Derby Ct
- 0 Derby Ct Unit 7306967
- 0 Derby Ct Unit 8526038
- 0 Derby Ct Unit 8494538
- 40 Derby Ct
- 25 Derby Ct
- 35 Derby Ct
- 45 Derby Ct
- 14645 Highway 36
- 14570 Highway 36
- 14660 Highway 36
- 14652 Highway 36
- 14660 Georgia 36
- 80 Hollow Ct
- 90 Hollow Ct
- 70 Hollow Ct
- 105 Willow Springs Dr
- 95 Hollow Ct
- 14690 Highway 36