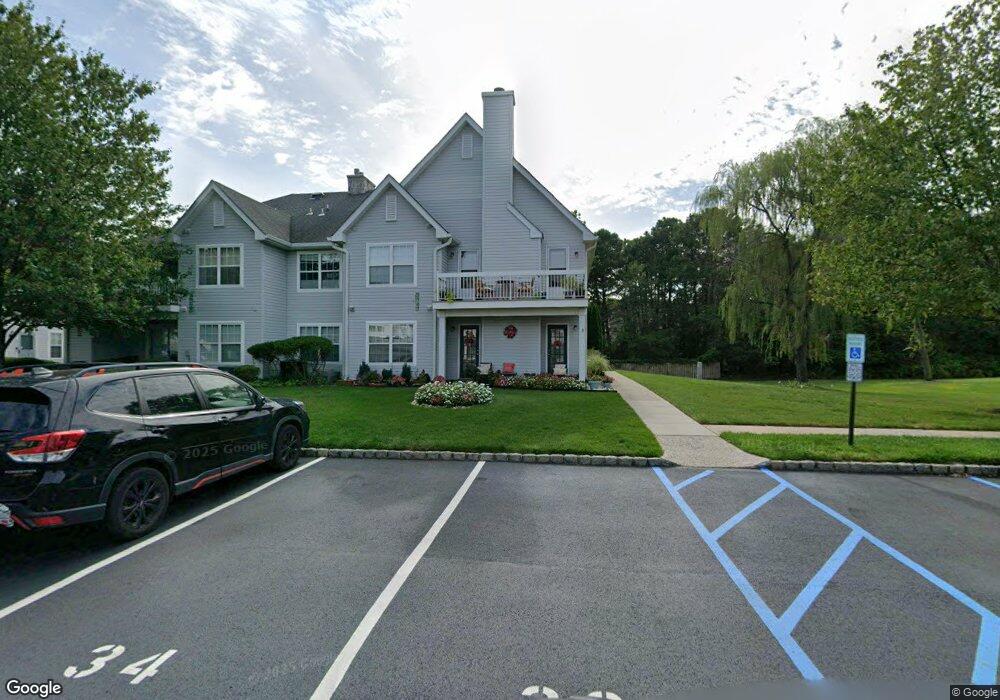
20 Des Moines Ct Tinton Falls, NJ 07712
Estimated Value: $377,758 - $392,000
2
Beds
2
Baths
950
Sq Ft
$407/Sq Ft
Est. Value
About This Home
This home is located at 20 Des Moines Ct, Tinton Falls, NJ 07712 and is currently estimated at $386,690, approximately $407 per square foot. 20 Des Moines Ct is a home located in Monmouth County with nearby schools including Mahala F. Atchinson Elementary School, Swimming River Elementary School, and Tinton Falls Middle School.
Ownership History
Date
Name
Owned For
Owner Type
Purchase Details
Closed on
Feb 7, 2020
Sold by
Mancini Mary Susan
Bought by
Mancini Mary Susan and Colicchio Eugene S
Current Estimated Value
Home Financials for this Owner
Home Financials are based on the most recent Mortgage that was taken out on this home.
Original Mortgage
$160,000
Outstanding Balance
$141,991
Interest Rate
3.72%
Mortgage Type
New Conventional
Estimated Equity
$244,699
Purchase Details
Closed on
Feb 18, 1994
Sold by
Hovbilt Inc
Bought by
Mancini Charles and Mancini Yolanda
Home Financials for this Owner
Home Financials are based on the most recent Mortgage that was taken out on this home.
Original Mortgage
$72,000
Interest Rate
7.15%
Create a Home Valuation Report for This Property
The Home Valuation Report is an in-depth analysis detailing your home's value as well as a comparison with similar homes in the area
Home Values in the Area
Average Home Value in this Area
Purchase History
| Date | Buyer | Sale Price | Title Company |
|---|---|---|---|
| Mancini Mary Susan | -- | Quality Ttl & Abstract Agcy | |
| Mancini Charles | $91,250 | -- |
Source: Public Records
Mortgage History
| Date | Status | Borrower | Loan Amount |
|---|---|---|---|
| Open | Mancini Mary Susan | $160,000 | |
| Closed | Mancini Charles | $72,000 |
Source: Public Records
Tax History Compared to Growth
Tax History
| Year | Tax Paid | Tax Assessment Tax Assessment Total Assessment is a certain percentage of the fair market value that is determined by local assessors to be the total taxable value of land and additions on the property. | Land | Improvement |
|---|---|---|---|---|
| 2025 | $5,189 | $374,200 | $216,500 | $157,700 |
| 2024 | $5,123 | $360,600 | $206,500 | $154,100 |
| 2023 | $5,123 | $335,700 | $175,000 | $160,700 |
| 2022 | $4,457 | $268,100 | $115,000 | $153,100 |
| 2021 | $4,438 | $231,400 | $105,000 | $126,400 |
| 2020 | $4,561 | $228,600 | $105,000 | $123,600 |
| 2019 | $4,438 | $222,800 | $100,000 | $122,800 |
| 2018 | $4,188 | $209,600 | $100,000 | $109,600 |
| 2017 | $4,125 | $201,300 | $95,000 | $106,300 |
| 2016 | $4,236 | $202,100 | $90,000 | $112,100 |
| 2015 | $4,123 | $199,200 | $90,000 | $109,200 |
| 2014 | $3,951 | $182,600 | $70,000 | $112,600 |
Source: Public Records
Map
Nearby Homes
- 19 Des Moines Ct
- 23 Des Moines Ct
- 18 Des Moines Ct
- 18 Des Moines Ct Unit 40
- 24 Des Moines Ct
- 17 Des Moines Ct Unit 39
- 21 Des Moines Ct Unit 35
- 22 Des Moines Ct
- 27 Des Moines Ct
- 25 Des Moines Ct
- 26 Des Moines Ct
- 28 Des Moines Ct
- 31 Des Moines Ct Unit 29
- 29 Des Moines Ct
- 32 Des Moines Ct
- 30 Des Moines Ct
- 14 Des Moines Ct
- 16 Des Moines Ct
- 15 Des Moines Ct Unit 21
- 34 Des Moines Ct