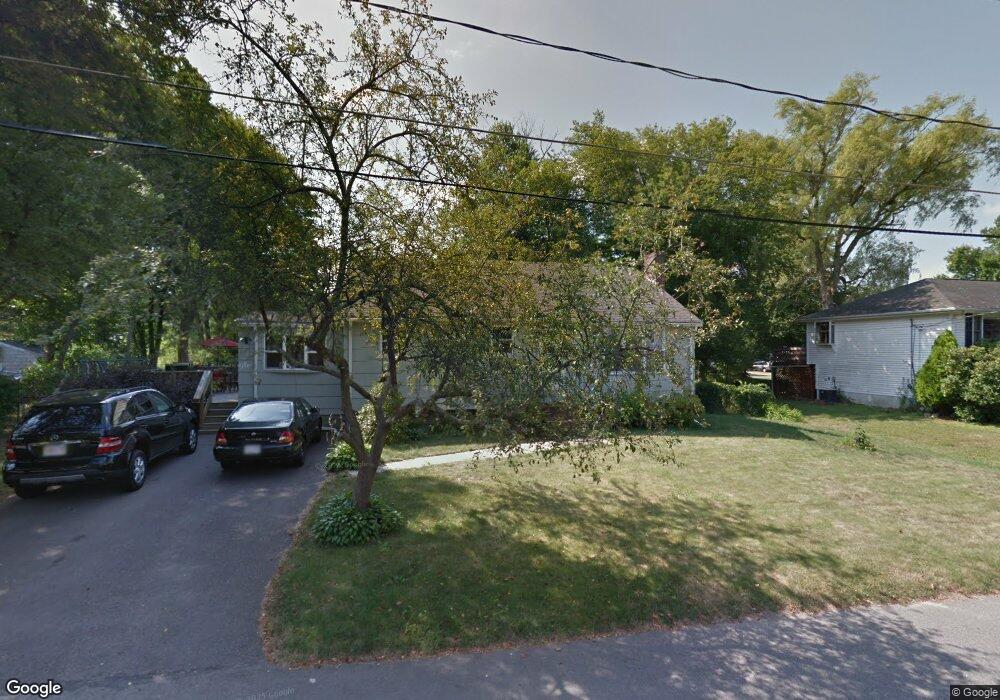
20 Dewey Ave Brockton, MA 02301
Estimated Value: $544,417 - $555,000
3
Beds
2
Baths
1,652
Sq Ft
$333/Sq Ft
Est. Value
About This Home
This home is located at 20 Dewey Ave, Brockton, MA 02301 and is currently estimated at $549,604, approximately $332 per square foot. 20 Dewey Ave is a home located in Plymouth County with nearby schools including Hancock Elementary School, Manthala George Jr. School, and Louis F Angelo Elementary School.
Ownership History
Date
Name
Owned For
Owner Type
Purchase Details
Closed on
Jan 11, 2016
Sold by
Wood Richard E and Wood Michelle L
Bought by
Gomes Kevin P
Current Estimated Value
Home Financials for this Owner
Home Financials are based on the most recent Mortgage that was taken out on this home.
Original Mortgage
$148,750
Outstanding Balance
$118,304
Interest Rate
3.96%
Mortgage Type
New Conventional
Estimated Equity
$431,300
Purchase Details
Closed on
Apr 30, 2003
Sold by
20 Dewey Ave T
Bought by
Wood Richard E and Wood Michelle L
Create a Home Valuation Report for This Property
The Home Valuation Report is an in-depth analysis detailing your home's value as well as a comparison with similar homes in the area
Home Values in the Area
Average Home Value in this Area
Purchase History
| Date | Buyer | Sale Price | Title Company |
|---|---|---|---|
| Gomes Kevin P | $239,000 | -- | |
| Wood Richard E | $245,000 | -- |
Source: Public Records
Mortgage History
| Date | Status | Borrower | Loan Amount |
|---|---|---|---|
| Open | Gomes Kevin P | $148,750 | |
| Previous Owner | Wood Richard E | $250,000 |
Source: Public Records
Tax History Compared to Growth
Tax History
| Year | Tax Paid | Tax Assessment Tax Assessment Total Assessment is a certain percentage of the fair market value that is determined by local assessors to be the total taxable value of land and additions on the property. | Land | Improvement |
|---|---|---|---|---|
| 2025 | $5,497 | $453,900 | $144,200 | $309,700 |
| 2024 | $5,187 | $431,500 | $144,200 | $287,300 |
| 2023 | $5,135 | $395,600 | $109,000 | $286,600 |
| 2022 | $4,599 | $329,200 | $99,000 | $230,200 |
| 2021 | $4,530 | $312,400 | $92,100 | $220,300 |
| 2020 | $4,580 | $302,300 | $88,400 | $213,900 |
| 2019 | $4,138 | $266,300 | $82,100 | $184,200 |
| 2018 | $4,012 | $249,800 | $82,100 | $167,700 |
| 2017 | $3,788 | $235,300 | $82,100 | $153,200 |
| 2016 | $3,937 | $226,800 | $78,200 | $148,600 |
| 2015 | $3,888 | $214,200 | $78,200 | $136,000 |
| 2014 | $3,385 | $186,700 | $78,200 | $108,500 |
Source: Public Records
Map
Nearby Homes