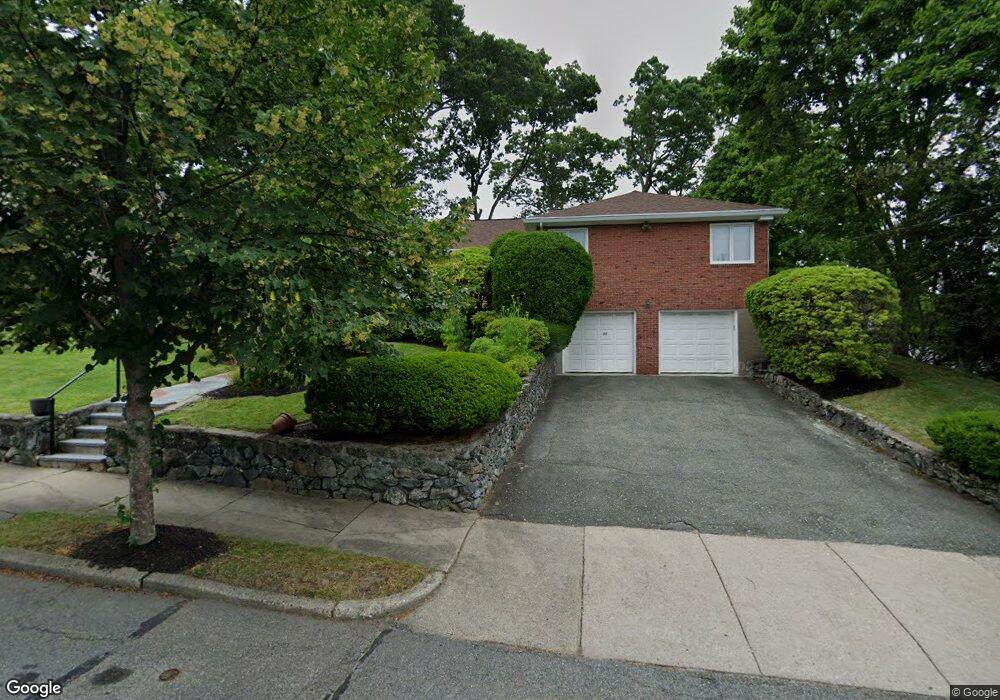
20 Dorothy Rd Newton Center, MA 02459
Mount Ida NeighborhoodEstimated Value: $1,174,000 - $1,399,000
3
Beds
2
Baths
1,914
Sq Ft
$678/Sq Ft
Est. Value
About This Home
This home is located at 20 Dorothy Rd, Newton Center, MA 02459 and is currently estimated at $1,297,206, approximately $677 per square foot. 20 Dorothy Rd is a home located in Middlesex County with nearby schools including Memorial Spaulding Elementary School, Oak Hill Middle School, and Newton South High School.
Ownership History
Date
Name
Owned For
Owner Type
Purchase Details
Closed on
Aug 27, 2021
Sold by
Weinograd Bruce G and Weinograd Maria M
Bought by
Weinograd Dorothy Rd Ret
Current Estimated Value
Create a Home Valuation Report for This Property
The Home Valuation Report is an in-depth analysis detailing your home's value as well as a comparison with similar homes in the area
Home Values in the Area
Average Home Value in this Area
Purchase History
| Date | Buyer | Sale Price | Title Company |
|---|---|---|---|
| Weinograd Dorothy Rd Ret | -- | None Available |
Source: Public Records
Tax History Compared to Growth
Tax History
| Year | Tax Paid | Tax Assessment Tax Assessment Total Assessment is a certain percentage of the fair market value that is determined by local assessors to be the total taxable value of land and additions on the property. | Land | Improvement |
|---|---|---|---|---|
| 2025 | $9,744 | $994,300 | $715,600 | $278,700 |
| 2024 | $9,421 | $965,300 | $694,800 | $270,500 |
| 2023 | $8,737 | $858,300 | $534,800 | $323,500 |
| 2022 | $8,360 | $794,700 | $495,200 | $299,500 |
| 2021 | $8,067 | $749,700 | $467,200 | $282,500 |
| 2020 | $7,827 | $749,700 | $467,200 | $282,500 |
| 2019 | $7,607 | $727,900 | $453,600 | $274,300 |
| 2018 | $7,167 | $662,400 | $408,000 | $254,400 |
| 2017 | $6,949 | $624,900 | $384,900 | $240,000 |
| 2016 | $6,646 | $584,000 | $359,700 | $224,300 |
| 2015 | $6,347 | $546,700 | $336,200 | $210,500 |
Source: Public Records
Map
Nearby Homes
- 853 Dedham St
- 36 Ober Rd
- 131 Wiswall Rd
- 21 Broken Tree Rd
- 21 Lovett Rd
- 133 Oak Hill St
- 44 Lovett Rd
- 55 June Ln
- 360 Brookline St
- 544 Saw Mill Brook Pkwy
- 27 Rosalie Rd
- 30 Esty Farm Rd
- 26 Cottonwood Rd
- 191 Spiers Rd
- 5 Kappius Path
- 135 Hartman Rd
- 63 Drumlin Rd
- 41 Juniper Ln
- 210 Nahanton St Unit 404
- 207 Nahanton St Unit 207