Estimated Value: $827,219 - $925,000
4
Beds
4
Baths
1,708
Sq Ft
$512/Sq Ft
Est. Value
About This Home
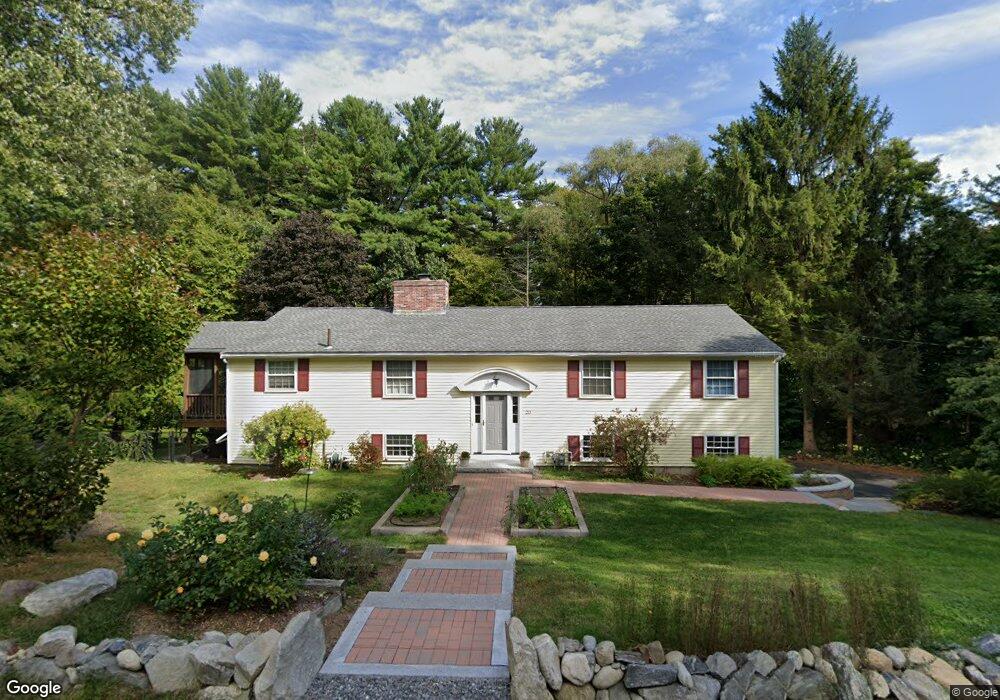
This home is located at 20 Duggan Rd, Acton, MA 01720 and is currently estimated at $874,305, approximately $511 per square foot. 20 Duggan Rd is a home located in Middlesex County with nearby schools including Acton-Boxborough Regional High School.
Ownership History
Date
Name
Owned For
Owner Type
Purchase Details
Closed on
Mar 28, 1996
Sold by
Peterson Dale G and Peterson Peggy K
Bought by
Hanselman Eric G and Hanselman Sarah E
Current Estimated Value
Purchase Details
Closed on
Mar 26, 1992
Sold by
Leonard William E and Leonard Ann M
Bought by
Peterson Dale and Peterson Peggy K
Create a Home Valuation Report for This Property
The Home Valuation Report is an in-depth analysis detailing your home's value as well as a comparison with similar homes in the area
Home Values in the Area
Average Home Value in this Area
Purchase History
| Date | Buyer | Sale Price | Title Company |
|---|---|---|---|
| Hanselman Eric G | $235,000 | -- | |
| Peterson Dale | $220,000 | -- |
Source: Public Records
Mortgage History
| Date | Status | Borrower | Loan Amount |
|---|---|---|---|
| Open | Peterson Dale | $50,000 | |
| Open | Peterson Dale | $187,000 | |
| Open | Peterson Dale | $390,000 |
Source: Public Records
Tax History
| Year | Tax Paid | Tax Assessment Tax Assessment Total Assessment is a certain percentage of the fair market value that is determined by local assessors to be the total taxable value of land and additions on the property. | Land | Improvement |
|---|---|---|---|---|
| 2025 | $13,017 | $759,000 | $340,800 | $418,200 |
| 2024 | $12,309 | $738,400 | $340,800 | $397,600 |
| 2023 | $12,097 | $688,900 | $309,800 | $379,100 |
| 2022 | $11,217 | $576,700 | $269,300 | $307,400 |
| 2021 | $10,534 | $520,700 | $249,300 | $271,400 |
| 2020 | $10,018 | $520,700 | $249,300 | $271,400 |
| 2019 | $9,546 | $492,800 | $249,300 | $243,500 |
| 2018 | $9,037 | $466,300 | $249,300 | $217,000 |
| 2017 | $8,707 | $456,800 | $249,300 | $207,500 |
| 2016 | $8,457 | $439,800 | $249,300 | $190,500 |
| 2015 | $8,342 | $437,900 | $249,300 | $188,600 |
| 2014 | $8,138 | $418,400 | $249,300 | $169,100 |
Source: Public Records
Map
Nearby Homes
- 90 Willow St Unit 1
- 92 Willow St Unit 3
- 92 Willow St Unit 2
- 280 W Acton Rd
- 247 W Acton Rd
- 235 Arlington St
- 40 Fifers Ln
- 184 Main St Unit 3
- 12 S Acton Rd
- 131 Main St
- 129 Main St Unit 129
- 25 Nylander Way
- 17 W View Ln Unit 17
- 20 Joseph Reed Ln
- 30-6 Taylor Rd
- 246 Main St Unit 2
- 7 Kelley Rd
- 40 High St
- 34 Meeting House Ln Unit 208
- 77 Wheeler Dr Unit 77
Your Personal Tour Guide
Ask me questions while you tour the home.