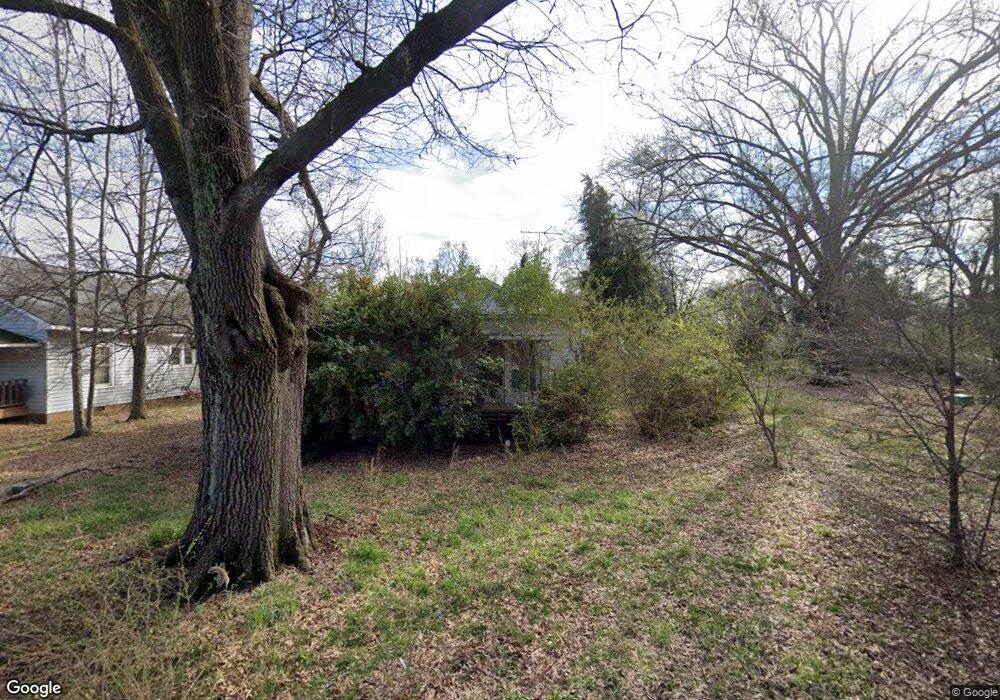
20 Dulin Dr SW Concord, NC 28027
Estimated Value: $263,000 - $291,000
3
Beds
2
Baths
1,198
Sq Ft
$229/Sq Ft
Est. Value
About This Home
This home is located at 20 Dulin Dr SW, Concord, NC 28027 and is currently estimated at $274,279, approximately $228 per square foot. 20 Dulin Dr SW is a home located in Cabarrus County with nearby schools including Wolf Meadow Elementary School, Roberta Road Middle School, and Branch Christian Academy.
Ownership History
Date
Name
Owned For
Owner Type
Purchase Details
Closed on
Feb 11, 2020
Sold by
Mora Propcopio Garcia and Mora Crescencio Martinez
Bought by
Segovia Jose and Flores Salazar Perla Dalila
Current Estimated Value
Home Financials for this Owner
Home Financials are based on the most recent Mortgage that was taken out on this home.
Original Mortgage
$150,300
Outstanding Balance
$138,427
Interest Rate
6%
Mortgage Type
New Conventional
Estimated Equity
$135,852
Purchase Details
Closed on
Jun 19, 2019
Sold by
Smith Berta A and Smith James C
Bought by
Garcia Mora Procopio
Purchase Details
Closed on
May 17, 2019
Sold by
Zion Equity Group Llc
Bought by
Smith Berta A
Purchase Details
Closed on
May 3, 2019
Sold by
Lambert Harvey and Lambert Phyllis Brooks
Bought by
Zion Equity Group Llc
Purchase Details
Closed on
Feb 18, 2019
Sold by
Stancil Virginia Long and Kilker Faye B
Bought by
Lambert Harvey and Lambert Phyllis Brooks
Create a Home Valuation Report for This Property
The Home Valuation Report is an in-depth analysis detailing your home's value as well as a comparison with similar homes in the area
Home Values in the Area
Average Home Value in this Area
Purchase History
| Date | Buyer | Sale Price | Title Company |
|---|---|---|---|
| Segovia Jose | $167,000 | None Available | |
| Garcia Mora Procopio | $63,000 | None Available | |
| Smith Berta A | $39,000 | None Available | |
| Zion Equity Group Llc | $22,500 | None Available | |
| Lambert Harvey | $5,500 | None Available |
Source: Public Records
Mortgage History
| Date | Status | Borrower | Loan Amount |
|---|---|---|---|
| Open | Segovia Jose | $150,300 |
Source: Public Records
Tax History Compared to Growth
Tax History
| Year | Tax Paid | Tax Assessment Tax Assessment Total Assessment is a certain percentage of the fair market value that is determined by local assessors to be the total taxable value of land and additions on the property. | Land | Improvement |
|---|---|---|---|---|
| 2025 | $2,866 | $287,780 | $52,000 | $235,780 |
| 2024 | $2,866 | $287,780 | $52,000 | $235,780 |
| 2023 | $1,996 | $163,610 | $19,800 | $143,810 |
| 2022 | $1,996 | $163,610 | $19,800 | $143,810 |
| 2021 | $1,996 | $163,610 | $19,800 | $143,810 |
| 2020 | $1,500 | $122,950 | $19,800 | $103,150 |
| 2019 | $662 | $54,300 | $12,600 | $41,700 |
| 2018 | $652 | $54,300 | $12,600 | $41,700 |
| 2017 | $641 | $54,300 | $12,600 | $41,700 |
| 2016 | $380 | $54,430 | $12,600 | $41,830 |
| 2015 | $318 | $54,430 | $12,600 | $41,830 |
| 2014 | $318 | $54,430 | $12,600 | $41,830 |
Source: Public Records
Map
Nearby Homes
- 207 Highland Ave SW
- 41 Fleetwood Dr SW
- 220 Highland Ave SW
- 933 Old Charlotte Rd
- 1015 Rockland Cir SW
- 64 Robinson Dr SW
- 782 Chalice St SW
- 82 Highland Ave SW
- 84 Highland Ave SW
- 758 Main St SW
- 809 Fargo Dr SW
- Lot #2 Faith Dr SW
- 620 Palmer Ave SW
- 368 Office Dr SW
- 1067 Old Charlotte Rd
- 131 Swink St SW
- 5 Bost Ave SW
- 0000 Bost Ave SW
- 7 Bost Ave SW
- 664 Jackson Terrace SW
- 20 Dulin Dr SW
- 19 Dulin Dr SW
- 41 Dulin Dr SW
- 41 Dulin Dr SW Unit 32
- 43 Dulin Dr SW
- 499 Union Cemetery Rd SW
- 501 Union Cemetery Rd SW
- 509 Union Cemetery Rd SW
- 489 Union Cemetery Rd SW
- 45 Dulin Dr SW
- 16 Dulin Dr SW Unit 18
- 495 Union Cemetery Rd SW
- 47 Dulin Dr SW
- 40 Dulin Dr SW
- 42 Dulin Dr SW
- 12 Dulin Dr SW
- 8 Dulin Dr SW
- 498 Union Cemetery Rd SW
- 49 Dulin Dr SW
- 854 Old Charlotte Rd SW